Home › Building histories › The Metamorphosis of Battersea › Chapter 4
Build 2 — 24 September 2026
– Class and Occupation
– Origins and Household Structure
– Battersea in 1887
– The Social Geography of Battersea
– Contemporary Views
– References
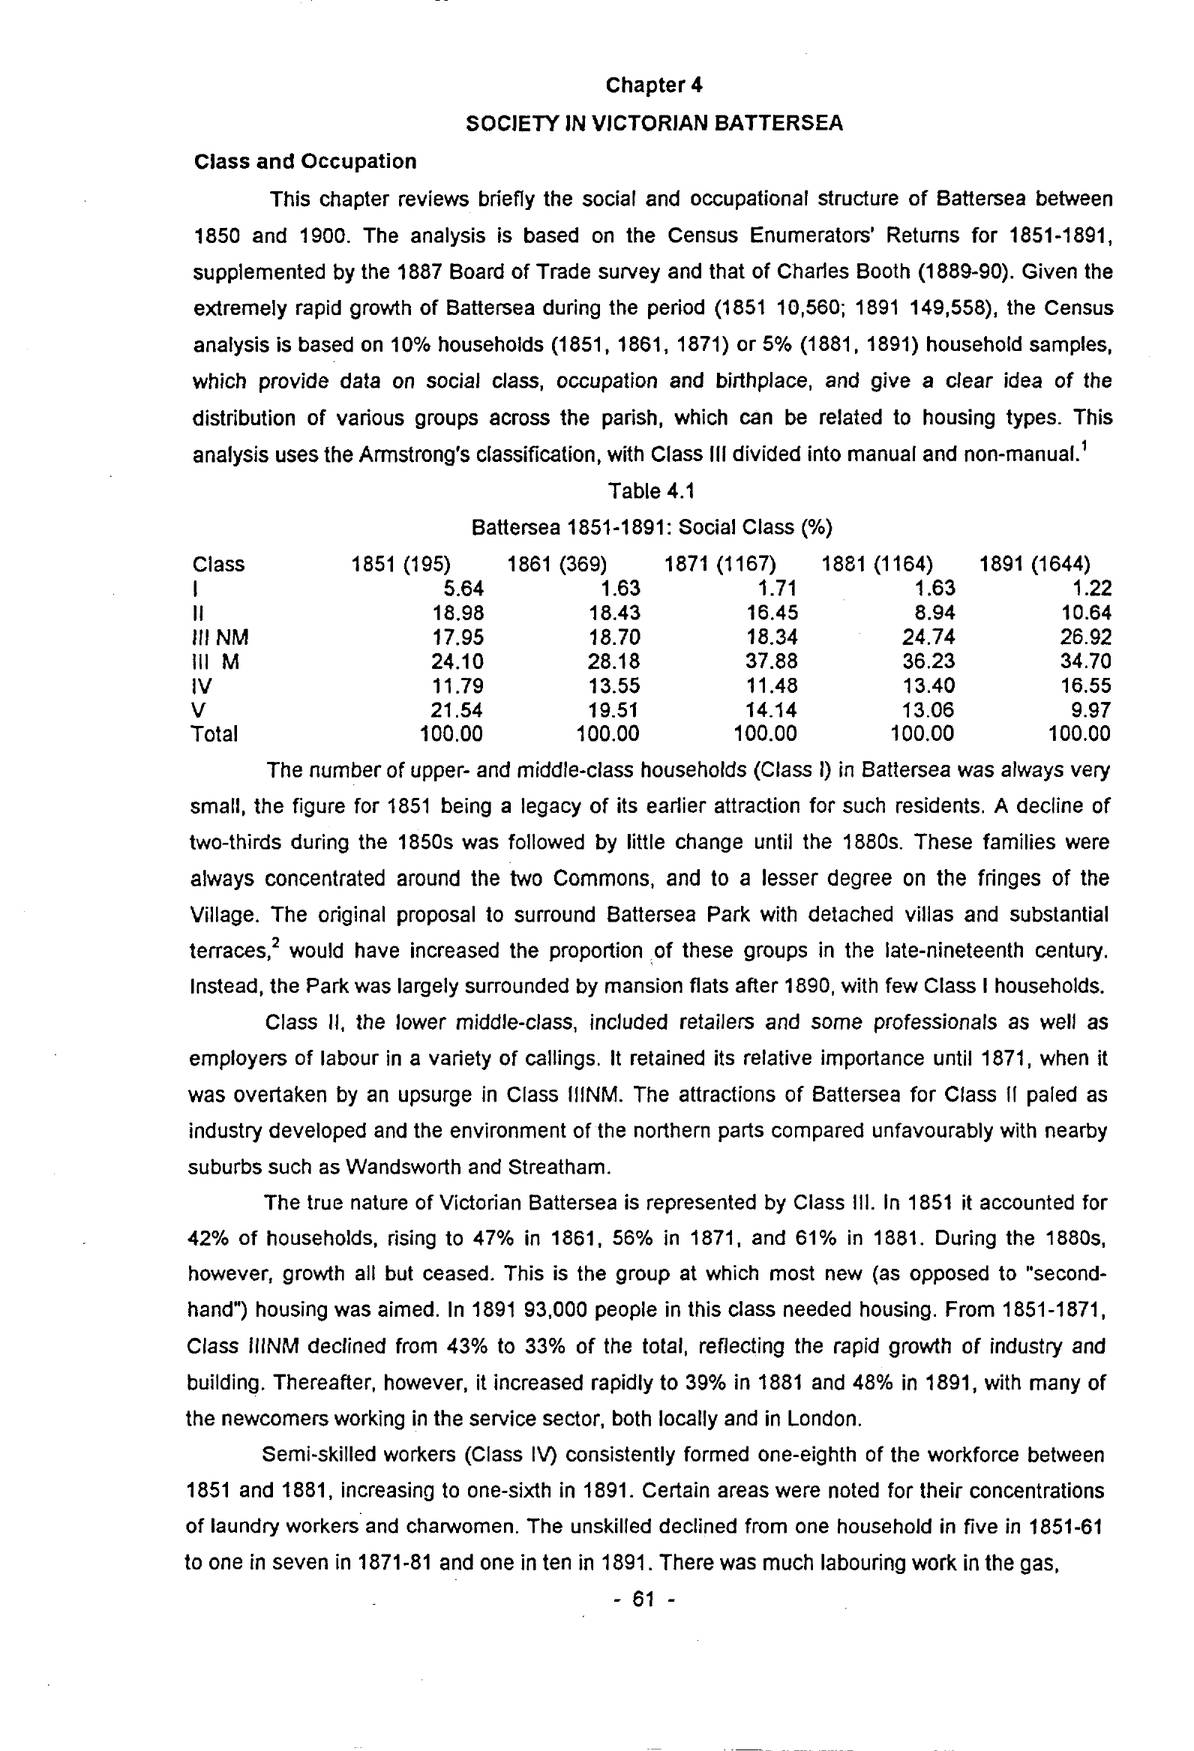
This chapter reviews briefly the social and occupational structure of Battersea between 1850 and 1900. The analysis is based on the Census Enumerators’ Returns for 1851-1891, supplemented by the 1887 Board of Trade survey and that of Charles Booth (1889-90). Given the extremely rapid growth of Battersea during the period (1851 10,560; 1891 149,558), the Census analysis is based on 10% households (1851, 1861, 1871) or 5% (1881, 1891) household samples, which provide data on social class, occupation and birthplace, and give a clear idea of the distribution of various groups across the parish, which can be related to housing types. This analysis uses the Armstrong’s classification, with Class III divided into manual and non-manual.1
| Class | 1851 (195) | 1861 (369) | 1871 (1167) | 1881 (1164) | 1891 (1644) |
|---|---|---|---|---|---|
| I | 5.64 | 1.63 | 1.71 | 1.63 | 1.22 |
| II | 18.98 | 18.43 | 16.45 | 8.94 | 10.64 |
| III NM | 17.95 | 18.70 | 18.34 | 24.74 | 26.92 |
| III M | 24.10 | 28.18 | 37.88 | 36.23 | 34.70 |
| IV | 11.79 | 13.55 | 11.48 | 13.40 | 16.55 |
| V | 21.54 | 19.51 | 14.14 | 13.06 | 9.97 |
| Total | 100.00 | 100.00 | 100.00 | 100.00 | 100.00 |
The number of upper- and middle-class households (Class I) in Battersea was always very small, the figure for 1851 being a legacy of its earlier attraction for such residents. A decline of two-thirds during the 1850s was followed by little change until the 1880s. These families were always concentrated around the two Commons, and to a lesser degree on the fringes of the Village. The original proposal to surround Battersea Park with detached villas and substantial terraces,2 would have increased the proportion of these groups in the late-nineteenth century. Instead, the Park was largely surrounded by mansion flats after 1890, with few Class I households.
Class II, the lower middle-class, included retailers and some professionals as well as employers of labour in a variety of callings. It retained its relative importance until 1871, when it was overtaken by an upsurge in Class IIINM. The attractions of Battersea for Class II paled as industry developed and the environment of the northern parts compared unfavourably with nearby suburbs such as Wandsworth and Streatham.
The true nature of Victorian Battersea is represented by Class III. In 1851 it accounted for 42% of households, rising to 47% in 1861, 56% in 1871, and 61% in 1881. During the 1880s, however, growth all but ceased. This is the group at which most new (as opposed to “second-hand”) housing was aimed. In 1891 93,000 people in this class needed housing. From 1851-1871, Class IIINM declined from 43% to 33% of the total, reflecting the rapid growth of industry and building. Thereafter, however, it increased rapidly to 39% in 1881 and 48% in 1891, with many of the newcomers working in the service sector, both locally and in London.
Semi-skilled workers (Class IV) consistently formed one-eighth of the workforce between 1851 and 1881, increasing to one-sixth in 1891. Certain areas were noted for their concentrations of laundry workers and charwomen. The unskilled declined from one household in five in 1851-61 to one in seven in 1871-81 and one in ten in 1891. There was much labouring work in the gas,
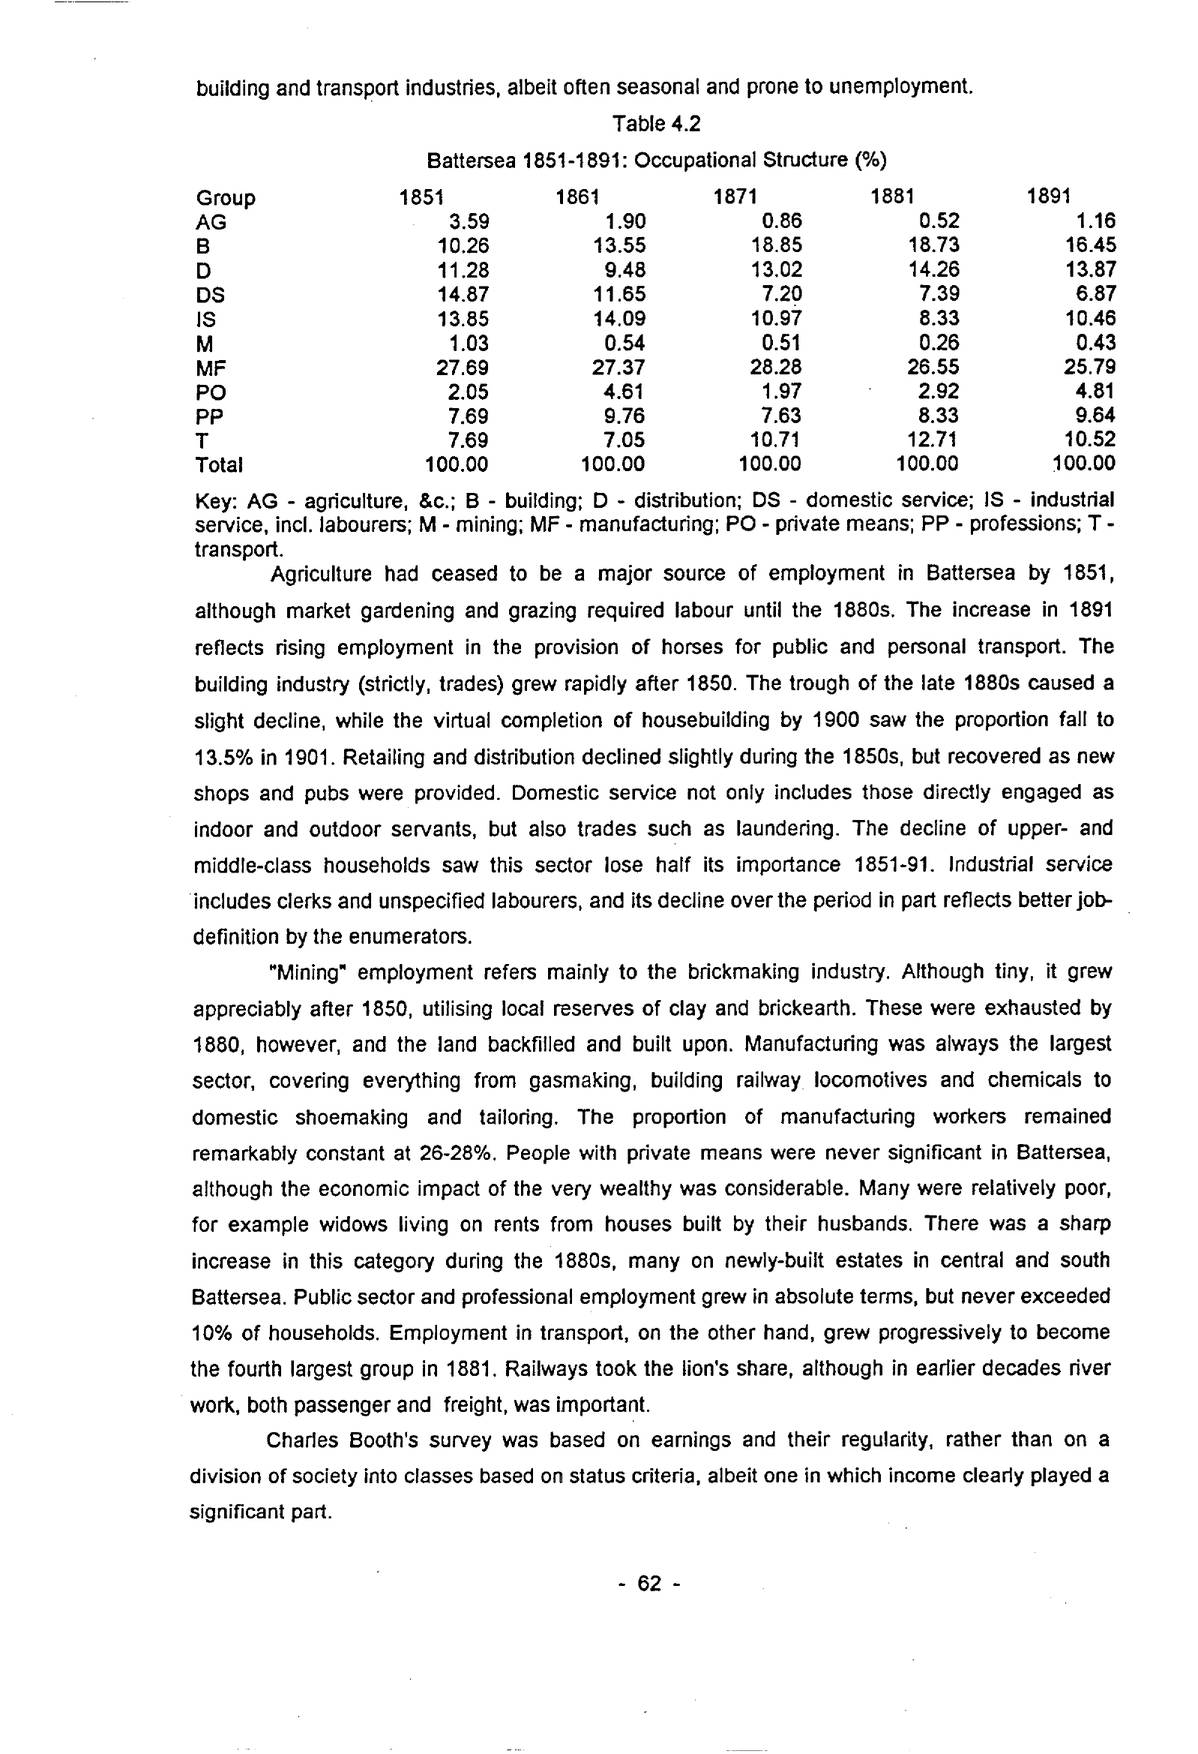
p. 62building and transport industries, albeit often seasonal and prone to unemployment.
| Group | 1851 | 1861 | 1871 | 1881 | 1891 |
|---|---|---|---|---|---|
| AG | 3.59 | 1.90 | 0.86 | 0.52 | 1.16 |
| B | 10.26 | 13.55 | 18.85 | 18.73 | 16.45 |
| D | 11.28 | 9.48 | 13.02 | 14.26 | 13.87 |
| DS | 14.87 | 11.65 | 7.20 | 7.39 | 6.87 |
| IS | 13.85 | 14.09 | 10.97 | 8.33 | 10.46 |
| M | 1.03 | 0.54 | 0.51 | 0.26 | 0.43 |
| MF | 27.69 | 27.37 | 28.28 | 26.55 | 25.79 |
| PO | 2.05 | 4.61 | 1.97 | 2.92 | 4.81 |
| PP | 7.69 | 9.76 | 7.63 | 8.33 | 9.64 |
| T | 7.69 | 7.05 | 10.71 | 12.71 | 10.52 |
| Total | 100.00 | 100.00 | 100.00 | 100.00 | 100.00 |
Key: AG – agriculture, &c.; B – building; D – distribution; DS – domestic service; IS – industrial service, incl. labourers; M – mining; MF – manufacturing; PO – private means; PP – professions; T – transport.
Agriculture had ceased to be a major source of employment in Battersea by 1851, although market gardening and grazing required labour until the 1880s. The increase in 1891 reflects rising employment in the provision of horses for public and personal transport. The building industry (strictly, trades) grew rapidly after 1850. The trough of the late 1880s caused a slight decline, while the virtual completion of housebuilding by 1900 saw the proportion fall to 13.5% in 1901. Retailing and distribution declined slightly during the 1850s, but recovered as new shops and pubs were provided. Domestic service not only includes those directly engaged as indoor and outdoor servants, but also trades such as laundering. The decline of upper- and middle-class households saw this sector lose half its importance 1851-91. Industrial service includes clerks and unspecified labourers, and its decline over the period in part reflects better job-definition by the enumerators.
“Mining” employment refers mainly to the brickmaking industry. Although tiny, it grew appreciably after 1850, utilising local reserves of clay and brickearth. These were exhausted by 1880, however, and the land backfilled and built upon. Manufacturing was always the largest sector, covering everything from gasmaking, building railway locomotives and chemicals to domestic shoemaking and tailoring. The proportion of manufacturing workers remained remarkably constant at 26-28%. People with private means were never significant in Battersea, although the economic impact of the very wealthy was considerable. Many were relatively poor, for example widows living on rents from houses built by their husbands. There was a sharp increase in this category during the 1880s, many on newly-built estates in central and south Battersea. Public sector and professional employment grew in absolute terms, but never exceeded 10% of households. Employment in transport, on the other hand, grew progressively to become the fourth largest group in 1881. Railways took the lion’s share, although in earlier decades river work, both passenger and freight, was important.
Charles Booth’s survey was based on earnings and their regularity, rather than on a division of society into classes based on status criteria, albeit one in which income clearly played a significant part.
| Class | Type | No. | % |
|---|---|---|---|
| A | Lowest/Semi-Criminal | 714 | 0.5 |
| B | Casual Earnings | 7737 | 5.1 |
| C | Irregular Earnings | 22856 | 14.9 |
| D | Regular Minimum Earnings | 19783 | 12.9 |
| E | Standard Earnings | 58718 | 38.4 |
| F | Highly Paid Artisans | 28420 | 18.6 |
| G | Lower Middle Class | 11593 | 7.6 |
| H | Middle Class | 3064 | 2.0 |
| Total | 152885 | 100.0 |
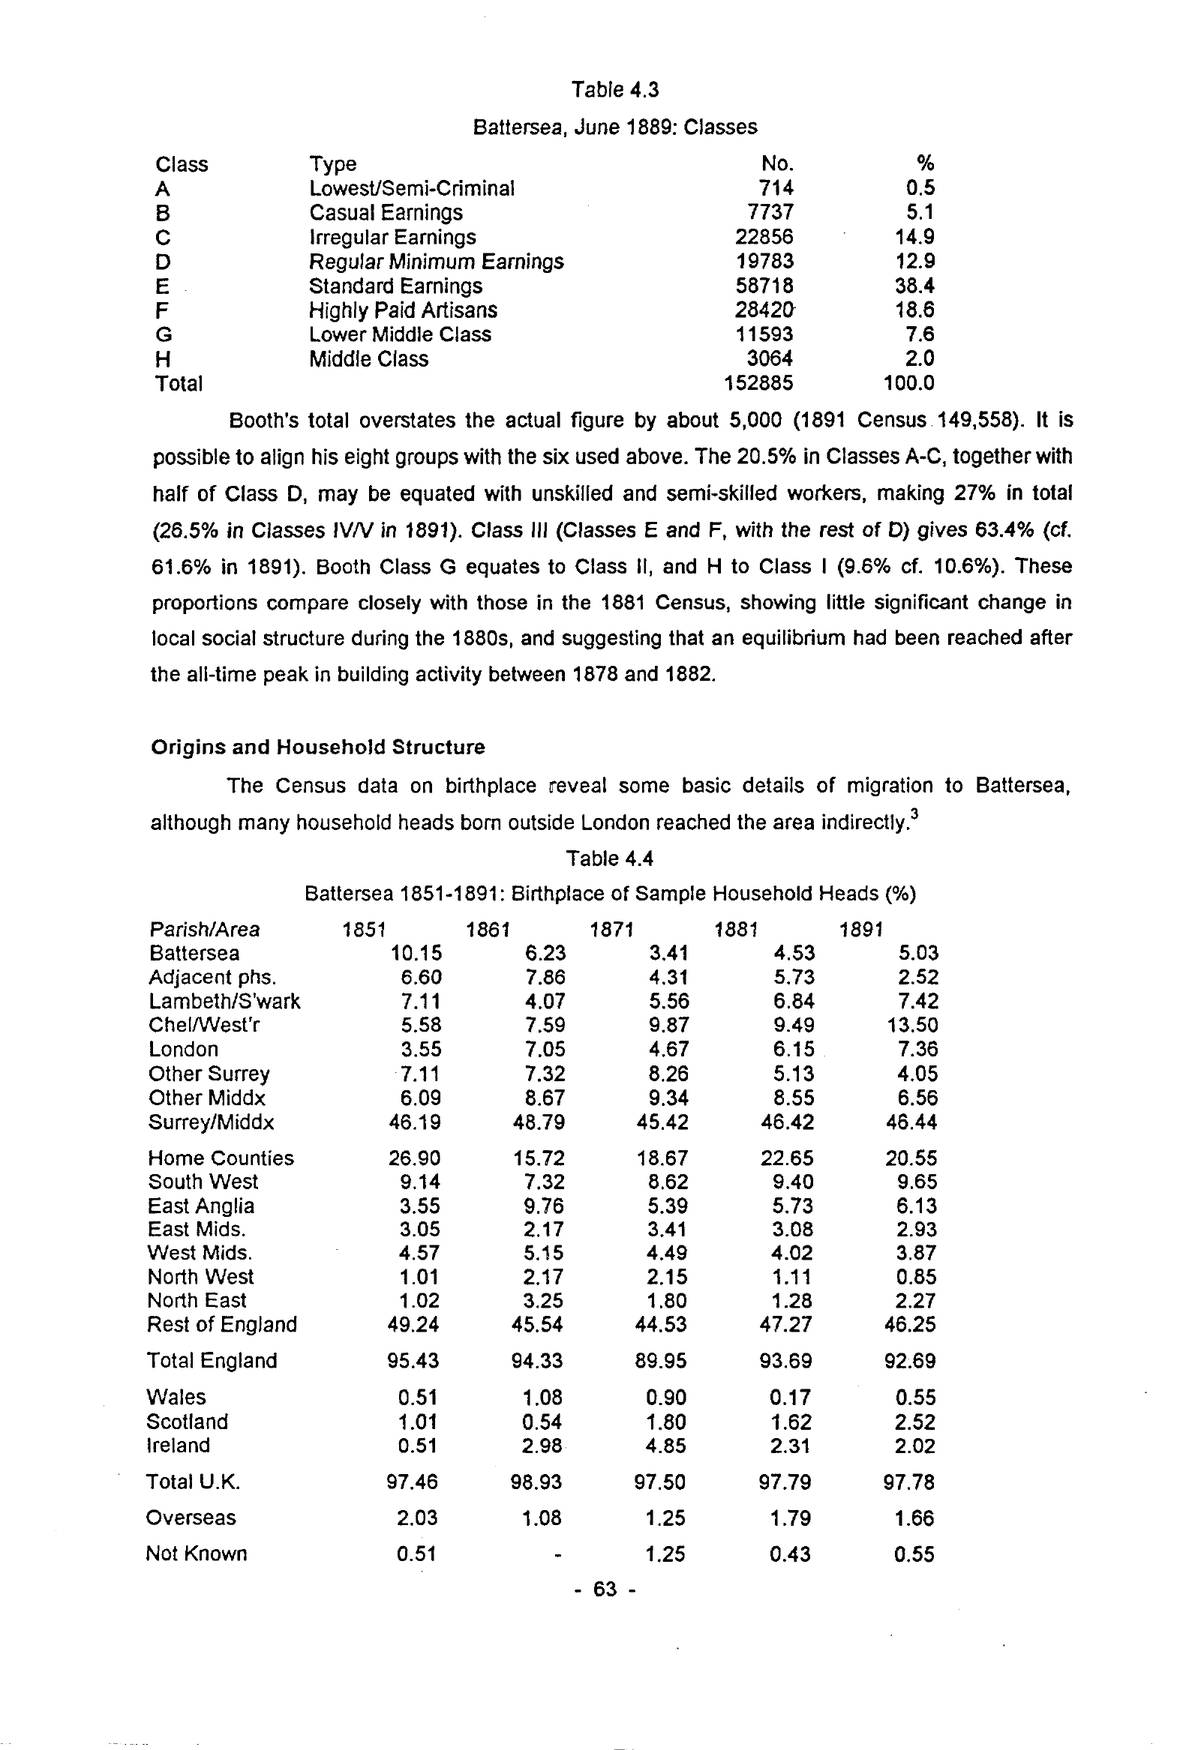
Booth’s total overstates the actual figure by about 5,000 (1891 Census 149,558). It is possible to align his eight groups with the six used above. The 20.5% in Classes A-C, together with half of Class D, may be equated with unskilled and semi-skilled workers, making 27% in total (26.5% in Classes IV/V in 1891). Class III (Classes E and F, with the rest of D) gives 63.4% (cf. 61.6% in 1891). Booth Class G equates to Class II, and H to Class I (9.6% cf. 10.6%). These proportions compare closely with those in the 1881 Census, showing little significant change in local social structure during the 1880s, and suggesting that an equilibrium had been reached after the all-time peak in building activity between 1878 and 1882.
The Census data on birthplace reveal some basic details of migration to Battersea, although many household heads born outside London reached the area indirectly.3
| Parish/Area | 1851 | 1861 | 1871 | 1881 | 1891 |
|---|---|---|---|---|---|
| Battersea | 10.15 | 6.23 | 3.41 | 4.53 | 5.03 |
| Adjacent phs. | 6.60 | 7.86 | 4.31 | 5.73 | 2.52 |
| Lambeth/S’wark | 7.11 | 4.07 | 5.56 | 6.84 | 7.42 |
| Chel/West’r | 5.58 | 7.59 | 9.87 | 9.49 | 13.50 |
| London | 3.55 | 7.05 | 4.67 | 6.15 | 7.36 |
| Other Surrey | 7.11 | 7.32 | 8.26 | 5.13 | 4.05 |
| Other Middx | 6.09 | 8.67 | 9.34 | 8.55 | 6.56 |
| Surrey/Middx | 46.19 | 48.79 | 45.42 | 46.42 | 46.44 |
| Home Counties | 26.90 | 15.72 | 18.67 | 22.65 | 20.55 |
| South West | 9.14 | 7.32 | 8.62 | 9.40 | 9.65 |
| East Anglia | 3.55 | 9.76 | 5.39 | 5.73 | 6.13 |
| East Mids. | 3.05 | 2.17 | 3.41 | 3.08 | 2.93 |
| West Mids. | 4.57 | 5.15 | 4.49 | 4.02 | 3.87 |
| North West | 1.01 | 2.17 | 2.15 | 1.11 | 0.85 |
| North East | 1.02 | 3.25 | 1.80 | 1.28 | 2.27 |
| Rest of England | 49.24 | 45.54 | 44.53 | 47.27 | 46.25 |
| Total England | 95.43 | 94.33 | 89.95 | 93.69 | 92.69 |
| Wales | 0.51 | 1.08 | 0.90 | 0.17 | 0.55 |
| Scotland | 1.01 | 0.54 | 1.80 | 1.62 | 2.52 |
| Ireland | 0.51 | 2.98 | 4.85 | 2.31 | 2.02 |
| Total U.K. | 97.46 | 98.93 | 97.50 | 97.79 | 97.78 |
| Overseas | 2.03 | 1.08 | 1.25 | 1.79 | 1.66 |
| Not Known | 0.51 | - | 1.25 | 0.43 | 0.55 |
p. 64Allowing for the random effects of sampling, the pattern of birthplaces remained remarkably constant throughout the period. Almost half of household heads were always born in Surrey and Middlesex, with around 20% from the Home Counties, and the same proportion from the rest of England. With the exception of Irish-born heads in 1871, the rest of the United Kingdom provided very few migrants. The transformation of village to suburb led to a halving of the numbers born in Battersea, and the same is generally true of neighbouring parishes. The proportion born in Chelsea and Westminster, however, more than doubled after 1851 and rose by 42% in the 1880s. Many were earlier migrants moving to newer housing on the suburban frontier. The westward bias reflects Battersea’s position in London and intervening opportunities for those from the north and east.
In both 1881 and 1891 about 17% of Battersea families took in either lodgers or boarders. Servant-keeping was less unusual than might be expected: in 1881 8% and in 1891 7% of households had living-in servants, and the proportion of the lower middle classes who had daily help was doubtless much greater. These families were not evenly distributed across the parish. Lodgers were concentrated in the Village area and in the streets south of Battersea Park Road, while boarders were significant in New Town. Lodgers and boarders were present in significantly less than expected numbers in estates inhabited by the skilled working class and clerks/shopworkers, where the pressure on finances was reduced by regular earnings. Servant-keeping was a feature of New Wandsworth, the Lavender Hill area and south Battersea generally, and was conspicuous by its absence in north-west and north-east Battersea, and in most artisan estates.
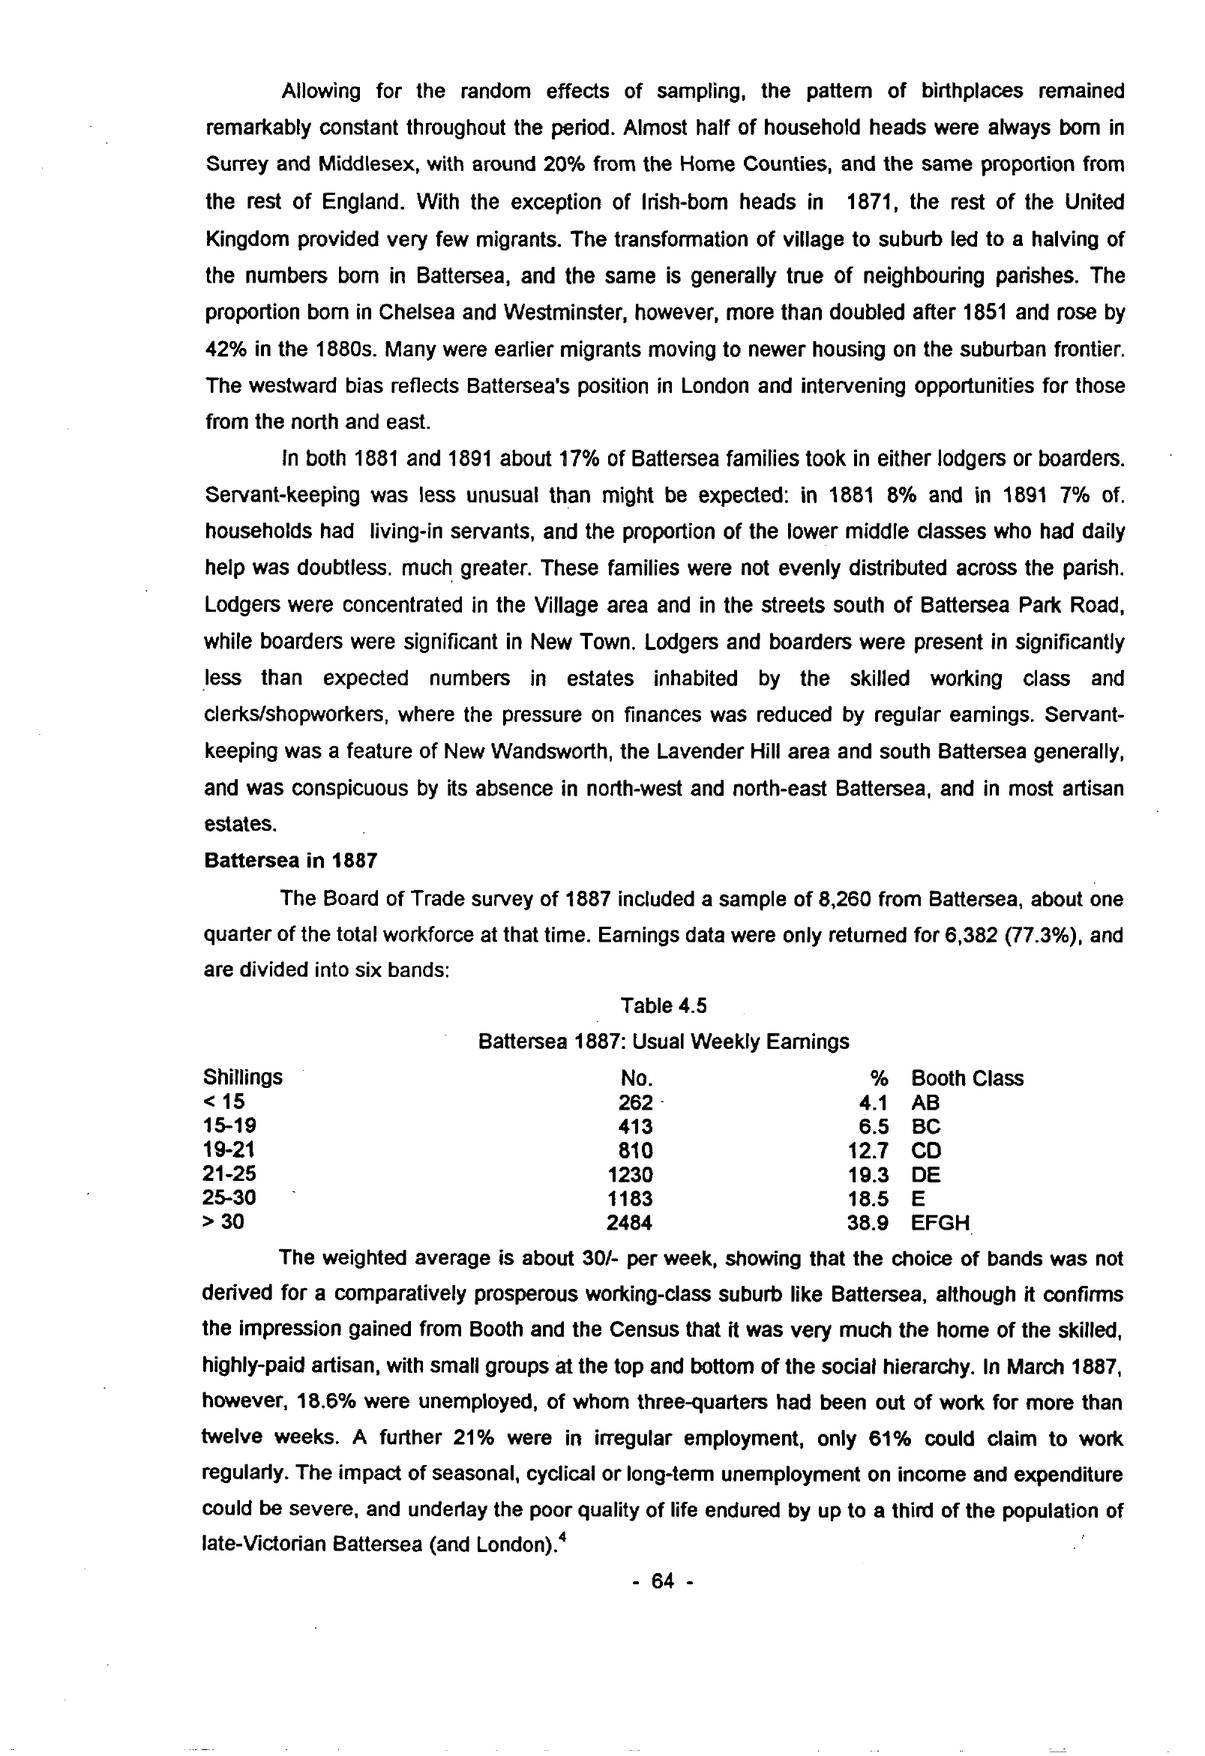
The Board of Trade survey of 1887 included a sample of 8,260 from Battersea, about one quarter of the total workforce at that time. Earnings data were only returned for 6,382 (77.3%), and are divided into six bands:
| Shillings | No. | % | Booth Class |
|---|---|---|---|
| < 15 | 262 | 4.1 | AB |
| 15-19 | 413 | 6.5 | BC |
| 19-21 | 810 | 12.7 | CD |
| 21-25 | 1230 | 19.3 | DE |
| 25-30 | 1183 | 18.5 | E |
| > 30 | 2484 | 38.9 | EFGH |
The weighted average is about 30/- per week, showing that the choice of bands was not derived for a comparatively prosperous working-class suburb like Battersea, although it confirms the impression gained from Booth and the Census that it was very much the home of the skilled, highly-paid artisan, with small groups at the top and bottom of the social hierarchy. In March 1887, however, 18.6% were unemployed, of whom three-quarters had been out of work for more than twelve weeks. A further 21% were in irregular employment, only 61% could claim to work regularly. The impact of seasonal, cyclical or long-term unemployment on income and expenditure could be severe, and underlay the poor quality of life endured by up to a third of the population of late-Victorian Battersea (and London).4
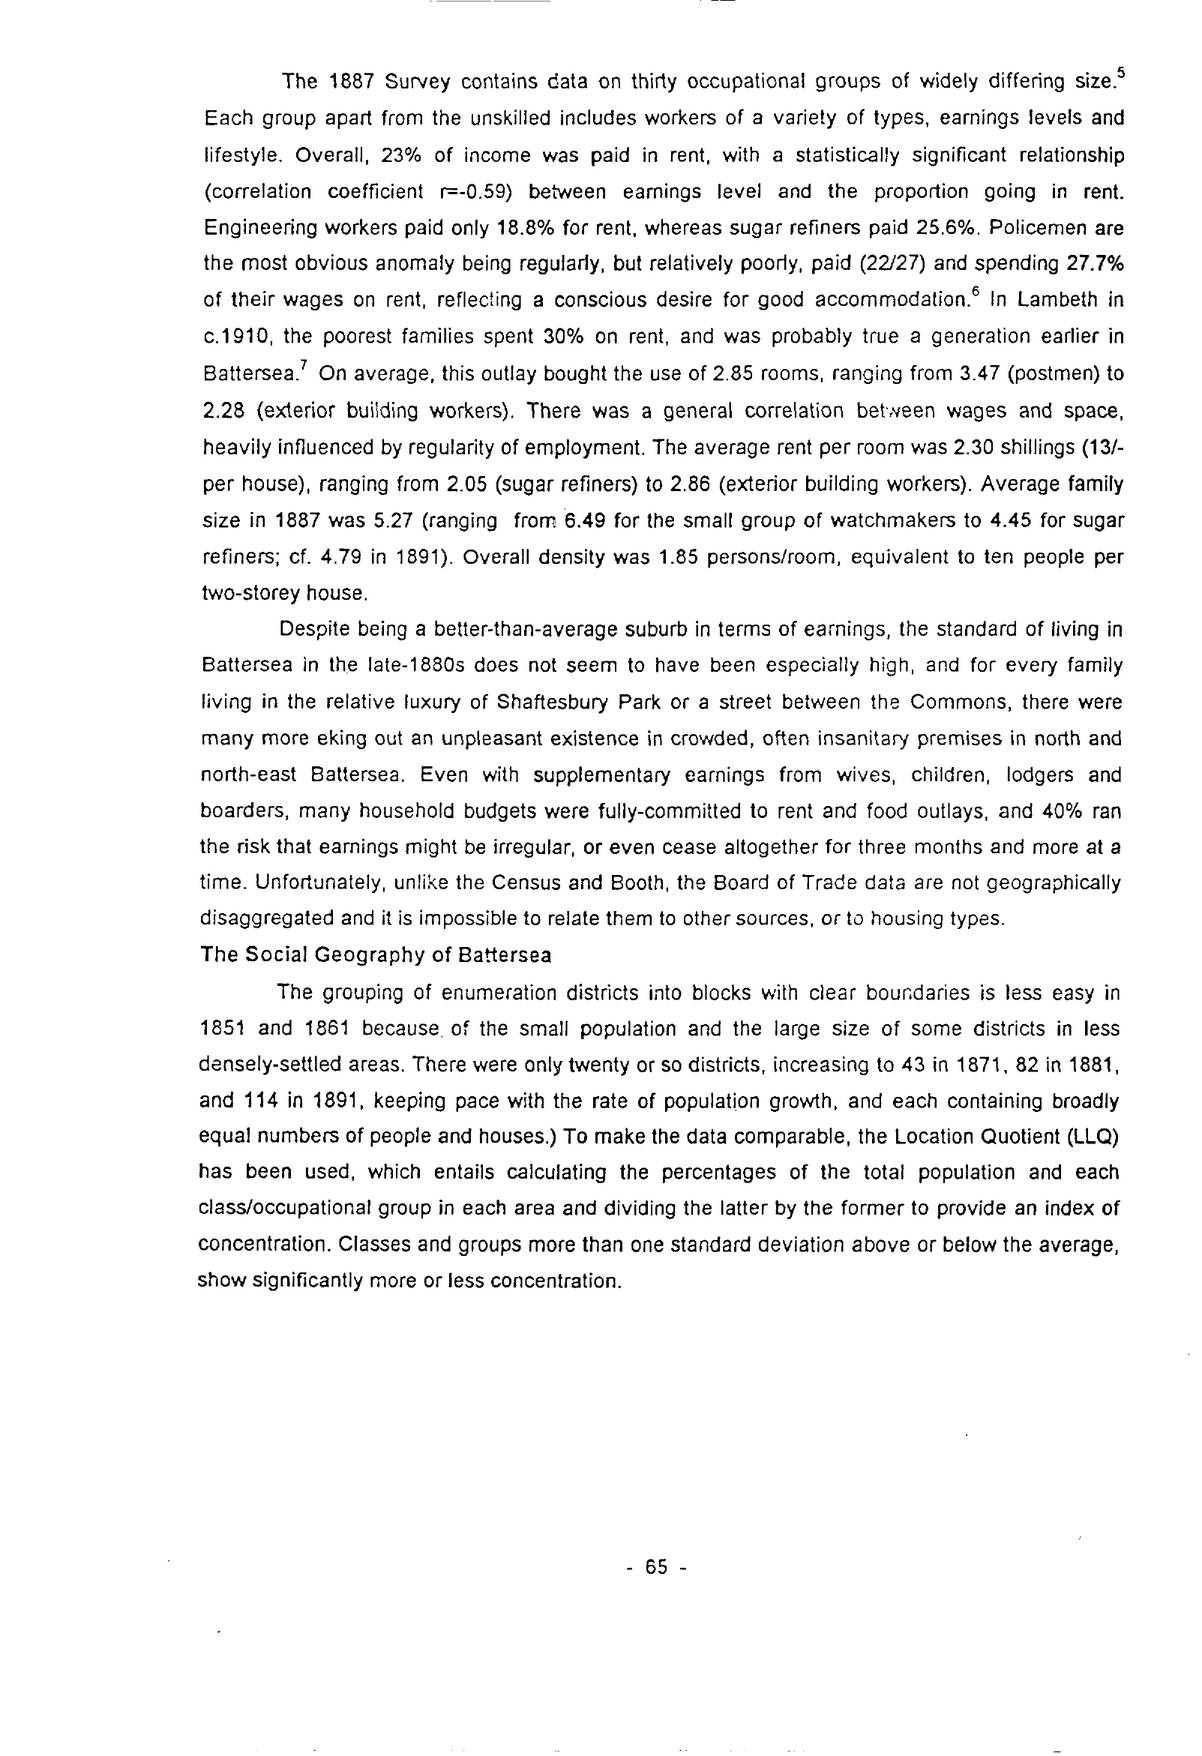
p. 65The 1887 Survey contains data on thirty occupational groups of widely differing size.5 Each group apart from the unskilled includes workers of a variety of types, earnings levels and lifestyle. Overall, 23% of income was paid in rent, with a statistically significant relationship (correlation coefficient r=-0.59) between earnings level and the proportion going in rent. Engineering workers paid only 18.8% for rent, whereas sugar refiners paid 25.6%. Policemen are the most obvious anomaly being regularly, but relatively poorly, paid (22/27) and spending 27.7% of their wages on rent, reflecting a conscious desire for good accommodation.6 In Lambeth in c.1910, the poorest families spent 30% on rent, and was probably true a generation earlier in Battersea.7 On average, this outlay bought the use of 2.85 rooms, ranging from 3.47 (postmen) to 2.28 (exterior building workers). There was a general correlation between wages and space, heavily influenced by regularity of employment. The average rent per room was 2.30 shillings (13/- per house), ranging from 2.05 (sugar refiners) to 2.86 (exterior building workers). Average family size in 1887 was 5.27 (ranging from 6.49 for the small group of watchmakers to 4.45 for sugar refiners; cf. 4.79 in 1891). Overall density was 1.85 persons/room, equivalent to ten people per two-storey house.
Despite being a better-than-average suburb in terms of earnings, the standard of living in Battersea in the late-1880s does not seem to have been especially high, and for every family living in the relative luxury of Shaftesbury Park or a street between the Commons, there were many more eking out an unpleasant existence in crowded, often insanitary premises in north and north-east Battersea. Even with supplementary earnings from wives, children, lodgers and boarders, many household budgets were fully-committed to rent and food outlays, and 40% ran the risk that earnings might be irregular, or even cease altogether for three months and more at a time. Unfortunately, unlike the Census and Booth, the Board of Trade data are not geographically disaggregated and it is impossible to relate them to other sources, or to housing types.
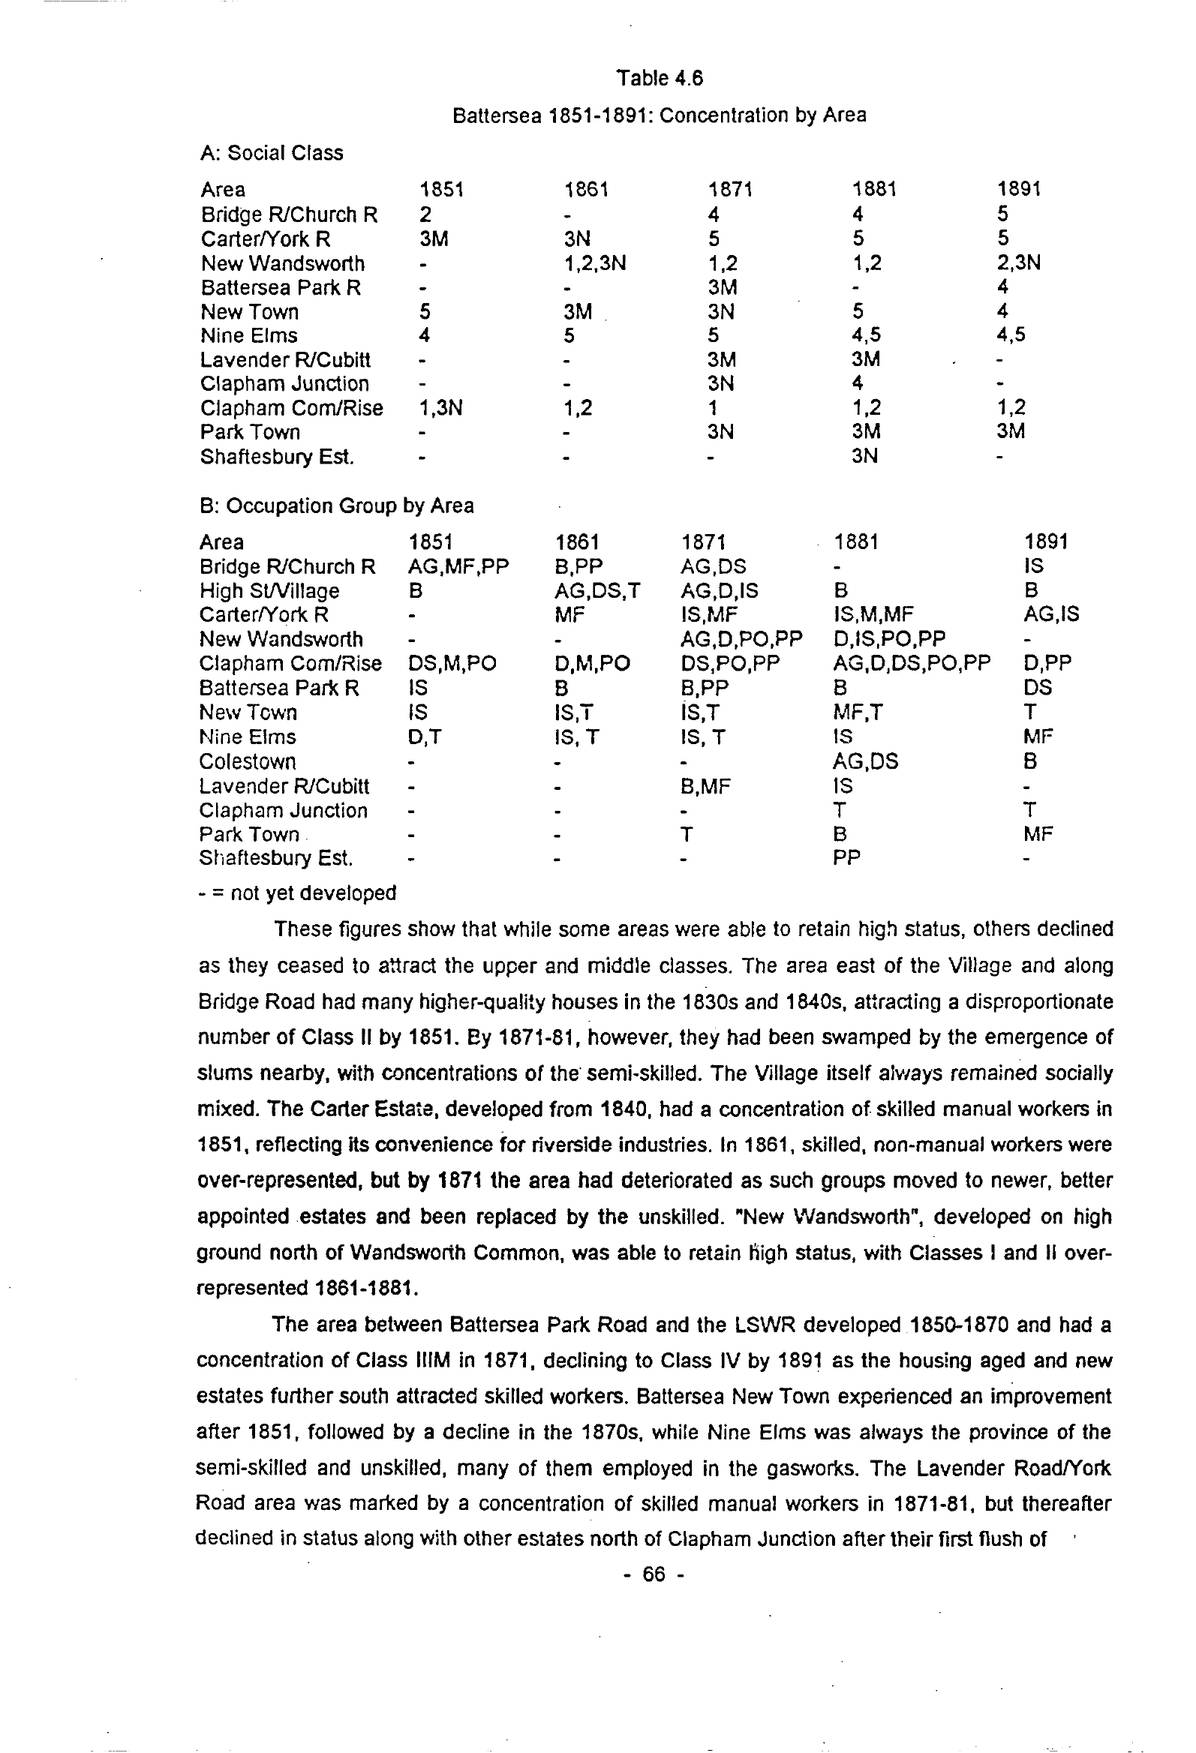
The grouping of enumeration districts into blocks with clear boundaries is less easy in 1851 and 1861 because of the small population and the large size of some districts in less densely-settled areas. There were only twenty or so districts, increasing to 43 in 1871, 82 in 1881, and 114 in 1891, keeping pace with the rate of population growth, and each containing broadly equal numbers of people and houses.) To make the data comparable, the Location Quotient (LLQ) has been used, which entails calculating the percentages of the total population and each class/occupational group in each area and dividing the latter by the former to provide an index of concentration. Classes and groups more than one standard deviation above or below the average, show significantly more or less concentration.
| A: Social Class | |||||
|---|---|---|---|---|---|
| Area | 1851 | 1861 | 1871 | 1881 | 1891 |
| Bridge R/Church R | 2 | - | 4 | 4 | 5 |
| Carter/York R | 3M | 3N | 5 | 5 | 5 |
| New Wandsworth | - | 1,2,3N | 1,2 | 1,2 | 2,3N |
| Battersea Park R | - | - | 3M | - | 4 |
| New Town | 5 | 3M | 3N | 5 | 4 |
| Nine Elms | 4 | 5 | 5 | 4,5 | 4,5 |
| Lavender R/Cubitt | - | - | 3M | 3M | - |
| Clapham Junction | - | - | 3N | 4 | - |
| Clapham Com/Rise | 1,3N | 1,2 | 1 | 1,2 | 1,2 |
| Park Town | - | - | 3N | 3M | 3M |
| Shaftesbury Est. | - | - | - | 3N | - |
| B: Occupation Group by Area | |||||
| Area | 1851 | 1861 | 1871 | 1881 | 1891 |
| Bridge R/Church R | AG,MF,PP | B,PP | AG,DS | - | IS |
| High St/Village | B | AG,DS,T | AG,D,IS | B | B |
| Carter/York R | - | MF | IS,MF | IS,M,MF | AG,IS |
| New Wandsworth | - | - | AG,D,PO,PP | D,IS,PO,PP | - |
| Clapham Com/Rise | DS,M,PO | D,M,PO | DS,PO,PP | AG,D,DS,PO,PP | D,PP |
| Battersea Park R | IS | B | B,PP | B | DS |
| New Town | IS | IS,T | IS,T | MF,T | T |
| Nine Elms | D,T | IS, T | IS, T | IS | MF |
| Colestown | - | - | - | AG,DS | B |
| Lavender R/Cubitt | - | - | B,MF | IS | - |
| Clapham Junction | - | - | - | T | T |
| Park Town | - | - | T | B | MF |
| Shaftesbury Est. | - | - | - | PP | - |
- = not yet developed
These figures show that while some areas were able to retain high status, others declined as they ceased to attract the upper and middle classes. The area east of the Village and along Bridge Road had many higher-quality houses in the 1830s and 1840s, attracting a disproportionate number of Class II by 1851. By 1871-81, however, they had been swamped by the emergence of slums nearby, with concentrations of the semi-skilled. The Village itself always remained socially mixed. The Carter Estate, developed from 1840, had a concentration of skilled manual workers in 1851, reflecting its convenience for riverside industries. In 1861, skilled, non-manual workers were over-represented, but by 1871 the area had deteriorated as such groups moved to newer, better appointed estates and been replaced by the unskilled. “New Wandsworth”, developed on high ground north of Wandsworth Common, was able to retain high status, with Classes I and II over-represented 1861-1881.
The area between Battersea Park Road and the LSWR developed 1850-1870 and had a concentration of Class IIIM in 1871, declining to Class IV by 1891 as the housing aged and new estates further south attracted skilled workers. Battersea New Town experienced an improvement after 1851, followed by a decline in the 1870s, while Nine Elms was always the province of the semi-skilled and unskilled, many of them employed in the gasworks. The Lavender Road/York Road area was marked by a concentration of skilled manual workers in 1871-81, but thereafter declined in status along with other estates north of Clapham Junction after their first flush of
p. 67newness in the 1860s. Clapham Common retained high status throughout the period 1851-1891, the grounds of its mansions not falling to the speculative builder until the mid-1890s. Park Town, an estate specifically aimed at the middle class, as evidenced by its grandiose three-storey terraces, was unsuccessful, and became the home of large colonies of skilled workers, as did the purpose-built Shaftesbury estate (1872-77). The latter had single-family houses, many owner-occupied from the start, in strong contrast to the multiple occupancy in Park Town.
The concentration of occupational groups reflects both their social status and the pattern of employment opportunities. Agricultural workers remained concentrated in and around the Village as late as 1891. Building workers were present in large numbers throughout Battersea after 1850, although there was a short-lived concentration south of Battersea Park Road and in Park Town 1871-81. Those employed in distribution were mainly shopkeepers, found along the principal thoroughfares and on corner sites elsewhere. The concentration in New Wandsworth and by Clapham Common reflects the presence of City merchants. These areas also had a predictable emphasis on domestic service.
Labourers show concentrations on the Carter Estate and Nine Elms/New Town, clerical workers in central and south Battersea. Manufacturing employment was concentrated in districts close to the Thames. The New Road-New Town area was favoured by those employed in the railway workshops. Those of private means and the professional classes were well represented in the high-status areas by the Commons, while policemen and government clerks and messengers were found in the Shaftesbury Estate and the Church Road area in appreciable numbers. By 1881, transport workers (essentially railwaymen) clustered around Clapham Junction and Nine Elms/New Town, the latter already apparent in 1861.
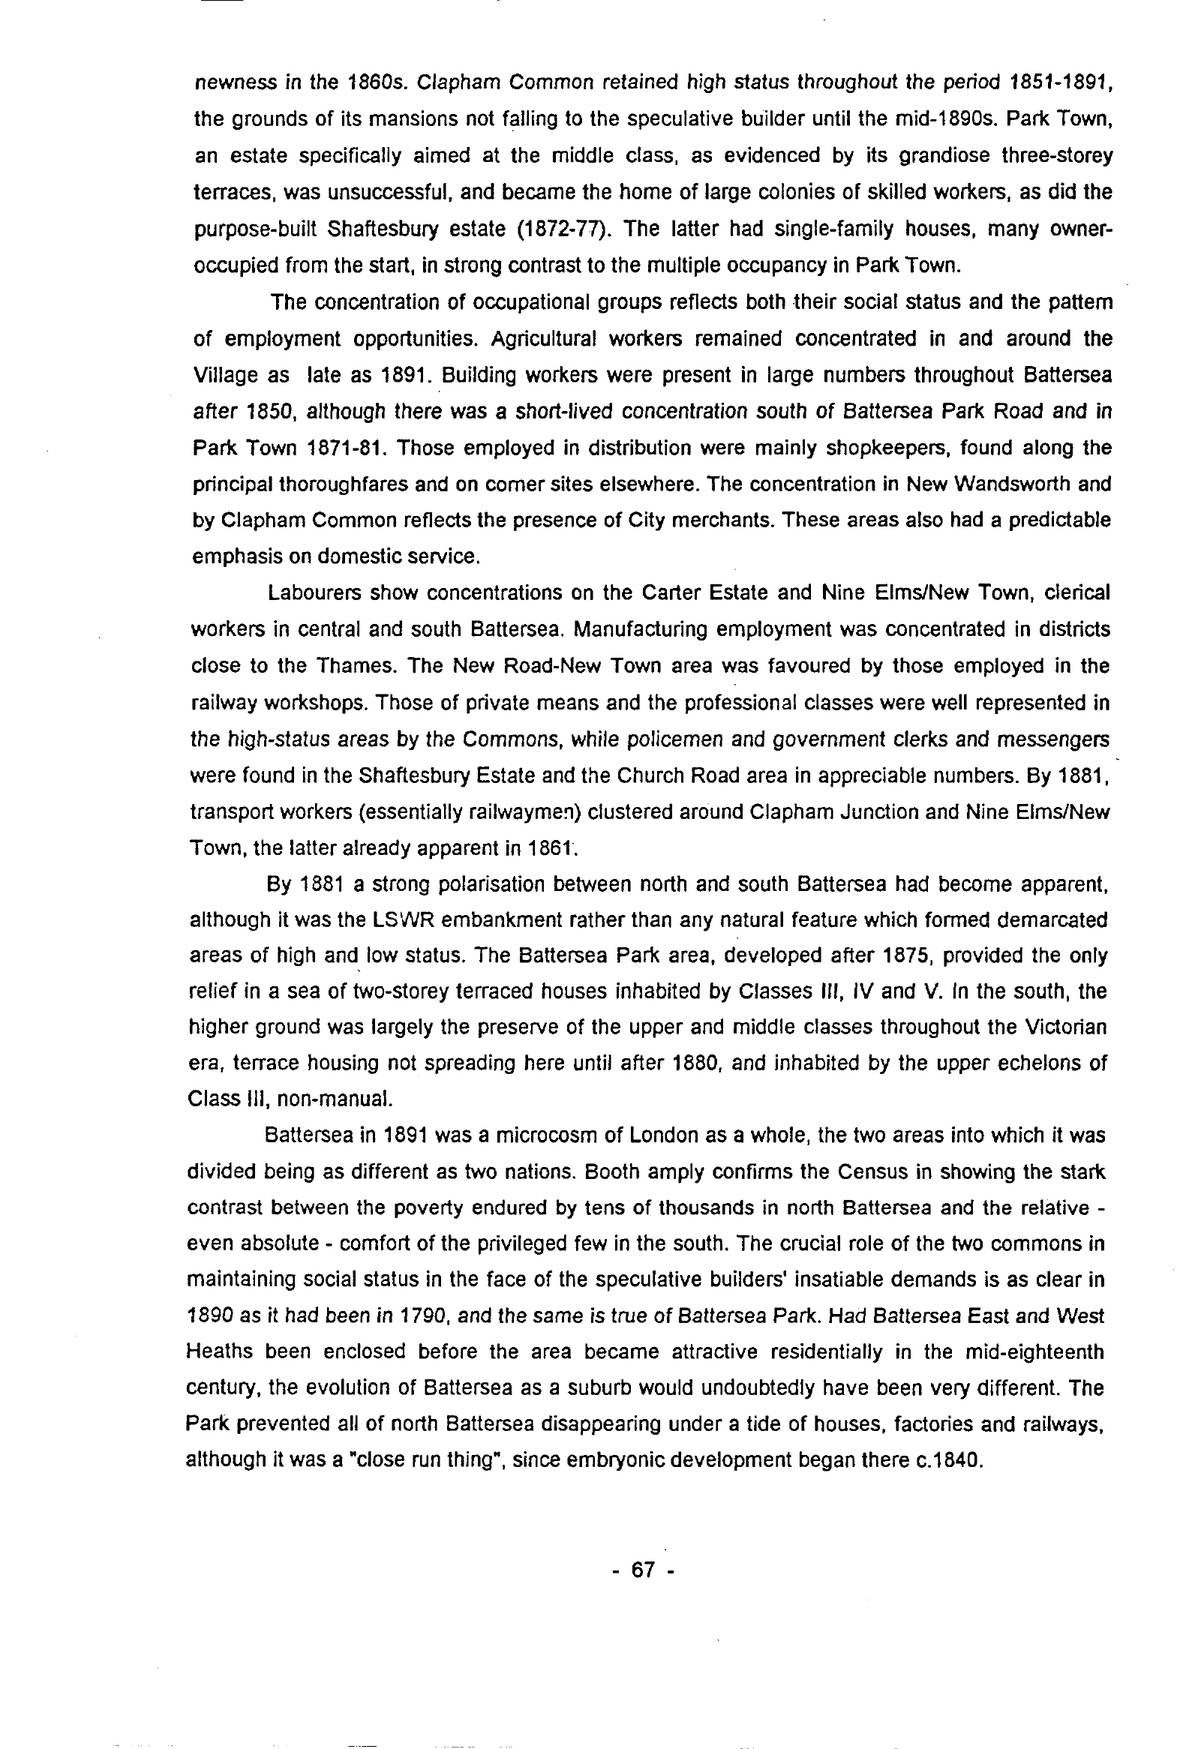
By 1881 a strong polarisation between north and south Battersea had become apparent, although it was the LSWR embankment rather than any natural feature which formed demarcated areas of high and low status. The Battersea Park area, developed after 1875, provided the only relief in a sea of two-storey terraced houses inhabited by Classes III, IV and V. In the south, the higher ground was largely the preserve of the upper and middle classes throughout the Victorian era, terrace housing not spreading here until after 1880, and inhabited by the upper echelons of Class III, non-manual.
Battersea in 1891 was a microcosm of London as a whole, the two areas into which it was divided being as different as two nations. Booth amply confirms the Census in showing the stark contrast between the poverty endured by tens of thousands in north Battersea and the relative – even absolute – comfort of the privileged few in the south. The crucial role of the two commons in maintaining social status in the face of the speculative builders’ insatiable demands is as clear in 1890 as it had been in 1790, and the same is true of Battersea Park. Had Battersea East and West Heaths been enclosed before the area became attractive residentially in the mid-eighteenth century, the evolution of Battersea as a suburb would undoubtedly have been very different. The Park prevented all of north Battersea disappearing under a tide of houses, factories and railways, although it was a “close run thing”, since embryonic development began there c.1840.
p. 68Two contemporary descriptions help to flesh out the dry statistics and provide glimpses of life in late-Victorian Battersea: Booth’s general survey and accounts of specific streets, and the vivid pen-pictures in Walter Besant’s London South of the Thames, published in 1912 but written in the 1890s.
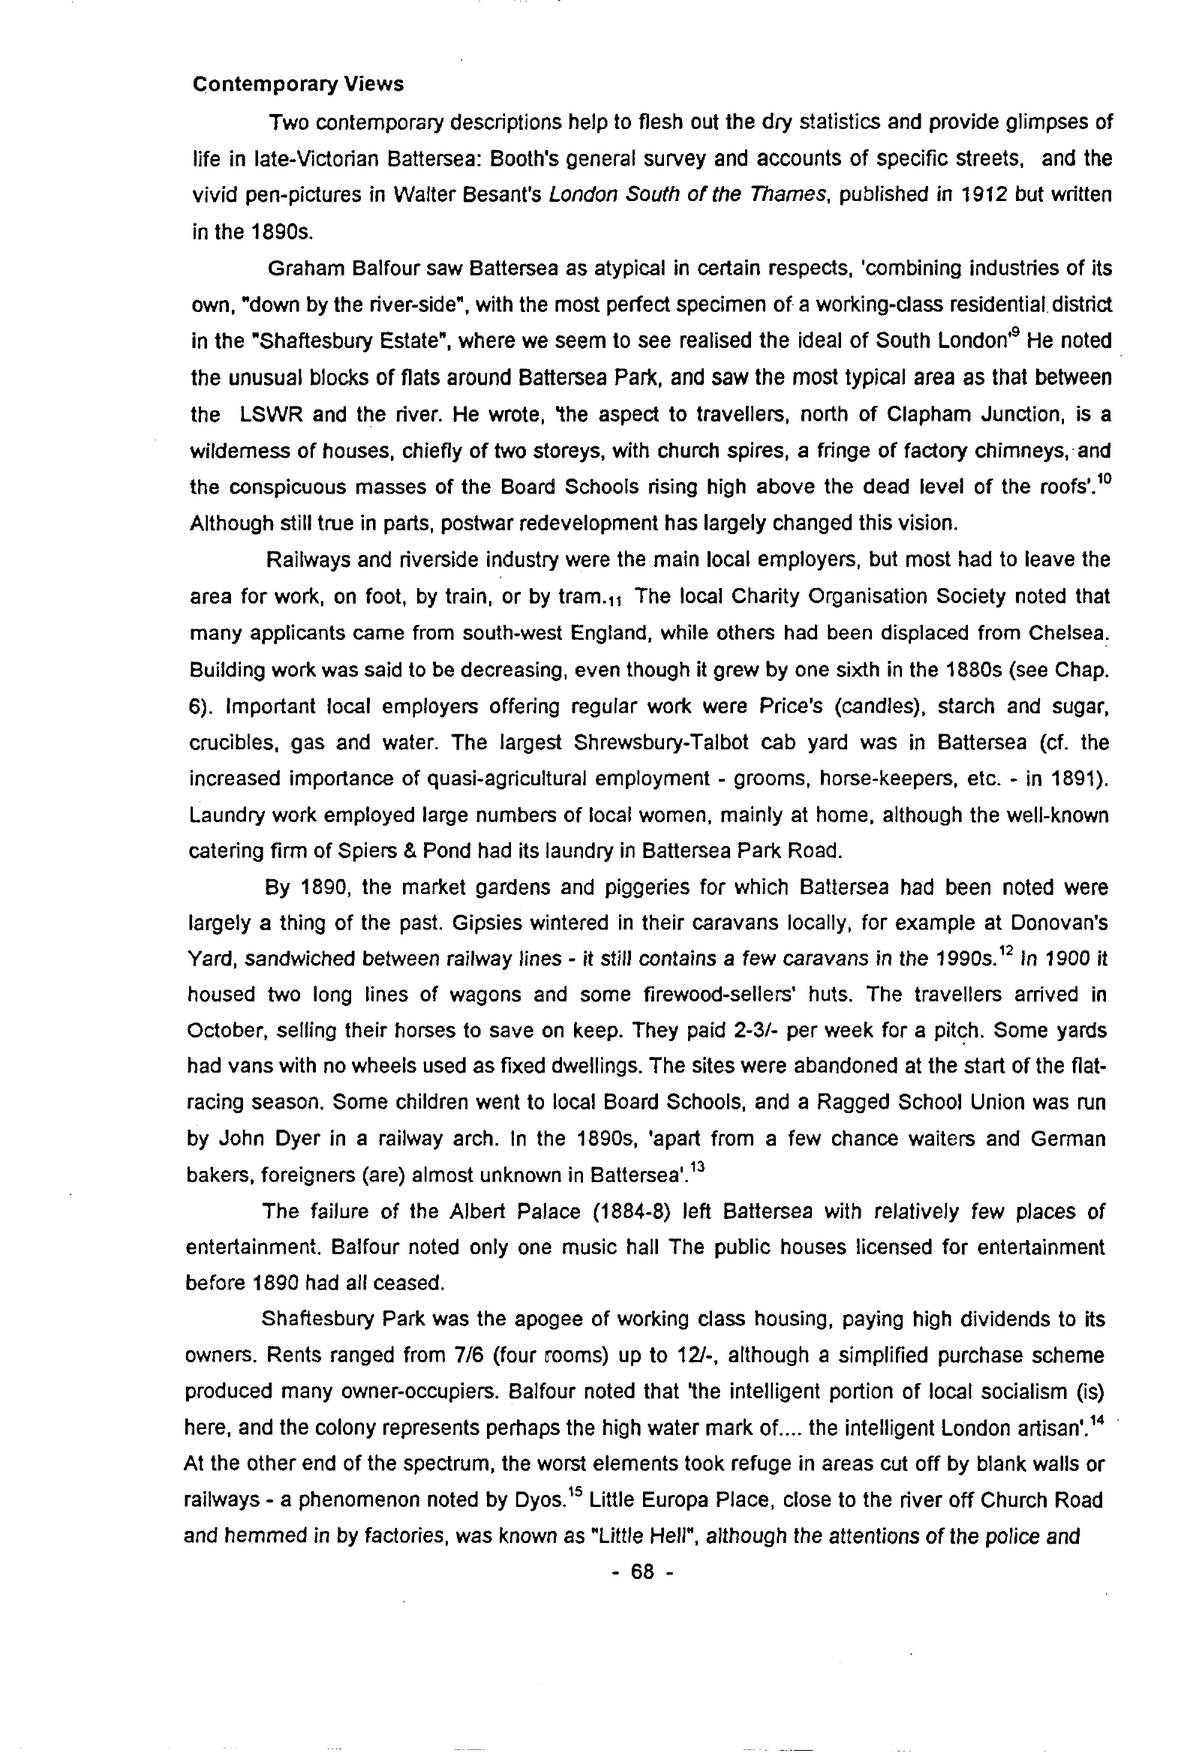
Graham Balfour saw Battersea as atypical in certain respects, ‘combining industries of its own, “down by the river-side”, with the most perfect specimen of a working-class residential district in the “Shaftesbury Estate”, where we seem to see realised the ideal of South London’9 He noted the unusual blocks of flats around Battersea Park, and saw the most typical area as that between the LSWR and the river. He wrote, ‘the aspect to travellers, north of Clapham Junction, is a wilderness of houses, chiefly of two storeys, with church spires, a fringe of factory chimneys, and the conspicuous masses of the Board Schools rising high above the dead level of the roofs’.10 Although still true in parts, postwar redevelopment has largely changed this vision.
Railways and riverside industry were the main local employers, but most had to leave the area for work, on foot, by train, or by tram.11 The local Charity Organisation Society noted that many applicants came from south-west England, while others had been displaced from Chelsea. Building work was said to be decreasing, even though it grew by one sixth in the 1880s (see Chap. 6). Important local employers offering regular work were Price’s (candles), starch and sugar, crucibles, gas and water. The largest Shrewsbury-Talbot cab yard was in Battersea (cf. the increased importance of quasi-agricultural employment – grooms, horse-keepers, etc. – in 1891). Laundry work employed large numbers of local women, mainly at home, although the well-known catering firm of Spiers & Pond had its laundry in Battersea Park Road.
By 1890, the market gardens and piggeries for which Battersea had been noted were largely a thing of the past. Gipsies wintered in their caravans locally, for example at Donovan’s Yard, sandwiched between railway lines – it still contains a few caravans in the 1990s.12 In 1900 it housed two long lines of wagons and some firewood-sellers’ huts. The travellers arrived in October, selling their horses to save on keep. They paid 2-3/- per week for a pitch. Some yards had vans with no wheels used as fixed dwellings. The sites were abandoned at the start of the flat-racing season. Some children went to local Board Schools, and a Ragged School Union was run by John Dyer in a railway arch. In the 1890s, ‘apart from a few chance waiters and German bakers, foreigners (are) almost unknown in Battersea’.13
The failure of the Albert Palace (1884-8) left Battersea with relatively few places of entertainment. Balfour noted only one music hall The public houses licensed for entertainment before 1890 had all ceased.
Shaftesbury Park was the apogee of working class housing, paying high dividends to its owners. Rents ranged from 7/6 (four rooms) up to 12/-, although a simplified purchase scheme produced many owner-occupiers. Balfour noted that ‘the intelligent portion of local socialism (is) here, and the colony represents perhaps the high water mark of.... the intelligent London artisan’.14 At the other end of the spectrum, the worst elements took refuge in areas cut off by blank walls or railways – a phenomenon noted by Dyos.15 Little Europa Place, close to the river off Church Road and hemmed in by factories, was known as “Little Hell”, although the attentions of the police and
p. 69School Board visitors had improved things somewhat. In 1871, only seven of the 108 children living there had gone to school, four in the family of the only teetotaller. The log books of Bolingbroke Road School record continuing problems with health, truancy, crime and bad language.16 Other pockets of Classes A and B were found in Nine Elms, where the Ponton Estate was virtually cut off from the rest of Battersea by railways, gas and water works; Britannia Place and nearby streets off Plough Lane – self-contained developments with poor external access; Latchmere Grove, hemmed-in by two branches of the WLER and once the location of many insanitary piggeries; Brougham and Berkley Streets off Culvert Road – another isolated estate turned in on itself, and the Linford Street area, surrounded by railway works and factories. All of these were classic slums, and although some had been built as long ago as the 1820s and 1830s, most were typical two-storey terraces built after 1860, and not necessarily jerry-built or predestined to decline.17 Environment was the crucial factor, and often changed during the life of the houses, leading to progressive drift down the social scale as artisans moved out to more salubrious areas. No less than 45% of Class B households were headed by widows, most of them employed at charring, laundry work or needlework.18
The Nine Elms enclave, with houses mostly built 1860-70 and unusually (for London) flush with the pavement, had ‘broken windows, cracked plaster, dirty children and drink-sodden women’.19 Barefoot, even naked, children were common, and people often slept in the streets in summer to avoid the vermin. The gasworks provided well paid, but seasonal and dangerous work, while many worked as costermongers. Orville Road, off the High Street was another pocket of poverty and crime, where the Church of England deaconesses had little impact.20 An older house and its grounds had been ‘turned into cheap rented accommodation by a speculator a few years ago’ (Henry Corsellis, father of the clerk to the D.B.W.).21 Each house had three floors, separately occupied and with three rooms. The earliest occupants in 1884-5 were artisans, but after a year ‘some bad lots got in (on) the odd-numbered side and change set in... families with little or no furniture... continually on the move, going hopping in summer’. Street gamblers were common, with pickets posted at the ends of the street to warn of the police.
Carpenter Street, built in the late 1870s, was another street which ‘was more poverty stricken than its particulars imply’. It and neighbouring Longhedge Street were ‘both sorry places’.22 Speke Road on the Clapham Junction estate of the Conservative Land Society, a body unconcerned with the type and quality of housing, despite the conditions attached to the sale of plots,23 contained poor three-storey houses, many ‘out of repair and wretchedly built... at least four windows show “mangling done here”’24
Victoria Dwellings in Battersea Park Road was prosperous but not popular. Its rules and relatively high rents restricted its appeal, as did the small size of many of the flats. In 1882, 62% of the tenants belonged to Class III, while 30% were semi-skilled and unskilled.25 Two of the three blocks were intended for labourers, containing 90 1- and 2-roomed tenements. The artisans’ block had 98 3- and 4-roomed tenements. Average rents were 2/4? per room, offering little advantage over more orthodox housing in the area.26 Lodging houses were not common in Battersea, Balfour says there were about six,27 a figure confirmed by the 1891 Census, where they appear for the first time, suggesting a shortage of housing in the late 1880s. All the common lodging houses were in
p. 70and around the old village, although there is no obvious explanation for this. 111 Westbridge Road housed 43 men, 32 of whom were labourers, and six building workers. One quarter were born in Battersea, almost five times the average for the whole population. More than fifty men were crowded into 116-120 Battersea High Street, but the enumerator was unable to obtain any details for individuals. Other lodging houses nearby at 37-41 and 65-67 Surrey Lane, housing 56 and 29 men respectively. None of these premises were especially large, so the degree of overcrowding is difficult to imagine, with six or more men per room.
Novelist Walter Besant presents a survey of Battersea c.1890. The actual perambulation of the streets was by J.C. Geikie,28 whose acute observations are invaluable in recapturing the atmosphere of late-Victorian Battersea. The sharp contrasts over short distances which characterised the area are shown by comparing the streets near Battersea Bridge containing the Shrewsbury-Talbot cab barns, a Salvation Army salvage wharf, the Imperial Oil Company’s stores, Wellington’s refinery, Ransome’s Dock and a brass foundry, with those south of the Park with their large houses and blocks of flats, although bakeries and catering firms were colonising Battersea Park Road, soon to be followed by the Polytechnic.29
Large tracts of homogeneous housing and social groups were the exception. The Carter Estate (Chap. 13) was ‘a region of small streets, badly kept, with poor shops and a poor class of people’30 (Booth C and D), whereas Harbut and Maysoule Roads ‘are new and well built’ (1881-4). East of Plough Lane ‘all the roads are lined with... commonplace terrace houses... the roads and footways crowded with playing children’.31 Many worked locally, on the railways or in riverside industry. Alfred Heaver’s Falcon Park estate was ‘better... clean and regularly built’ (Booth E), but Pocock’s and other estates (Booth D) contained ‘drab little houses, generally more or less sublet to lodgers’.32 There was a fundamental social distinction between Classes D and E, in effect the upper and lower ends of the great mass of Census Class III. Geikie confirms the view of Little Europa Place as a slum, ‘a very poor neighbourhood, dirty and with poor houses.33
The only area of active housebuilding around 1890 was between Lavender Hill and Clapham Common, an ‘entire district cut up with new roads and others in the making’.34 Nine Elms was ‘a mass of small streets at all angles... inclined to squalor... overrun by children’.35 Battersea New Town and the area off Thessaly Road were generally better, although Linford Street and its environs were ‘small and mean and in places filthy... shops of the worst type ministering to poorly paid wage-earners... among them are evil-smelling fish bars and the inevitable small squalid public houses with their attendant secondhand dealers’.36 The great mass of streets of Battersea Park Road were ‘small and mean, eminently squalid... some soulless being has named them after romantic kings and English premiers’.37 Broughton and Stanley Streets, grandiose terraces on the Park Town estate were ‘shadeless and swarming with children’, a far cry from the aspirations of their developers only a generation before.38 Contrary to Booth, Geikie saw Carpenter and Blondel Streets as very clean, whereas the average street in this area was full of small, dirty houses, ‘the people far from cleanly, while troops of children are obliged to play in the gutters’.39 Knots of idlers adorned each corner along the main road. Conditions within the average house were doubtless a strong incentive to live much of life outdoors.
These contemporary views of Battersea society show clearly the basic dichotomy between
p. 71the middle classes and the skilled artisan on the one hand and the semi-skilled and unskilled on the other. In some respects this was a simple north-south divide along the LSWR, but on closer examination this breaks down into a highly complex residential pattern in which the key determinant is ability to afford rent on a continuing basis, itself a reflection of the regularity of employment and earnings. The degree of social mixing in most streets belies the superficial similarity of the housing types. Only members of Class I, always rare in Battersea after 1850, appear to have consciously occupied or preserved small pockets of exclusivity, notably around the Commons. Even so, their continued presence in the old Village core in close proximity to some of the worst slums shows that segregation was far from being the norm, in this suburb at least.40
Transcribed from the typescript of 1995 and checked line by line against the page images. Keith Bailey’s wording, spelling and punctuation are kept. Errors made by the scanning software have been corrected silently. The grey page numbers in the margin (e.g. p. 5) give the original page, and can be clicked to see an image of it. Note numbers link to the references and back.
The following obvious typing slips in the typescript have also been corrected: “7% of. households” to “7% of households” (p. 64); “doubtless. much greater” to “doubtless much greater” (p. 64).
Keith Alan Bailey, The Metamorphosis of Battersea 1800–1914: A Building History, PhD thesis, The Open University, 1995. Digital edition published with the author’s permission; prepared by Philip Boys, 2026. Build 2 — 24 September 2026.