Part II: Building the Suburb: General
Introduction
Having set the historical, social and economic background to Battersea as a Victorian suburb in Part I, attention now turns to the building process and the men involved. Even, perhaps especially, at the parish level, this is a complex task, as a glance at the mosaic of building estates on Fig.7.1 confirms. While estates are numbered in scores, however, builders are numbered in hundreds and houses in thousands, and although statistics bulk large in Chapters 5, 6 and 7, the men behind them will be kept in view as far as the sources permit. It is regrettable that in more than thirty years since H.J. Dyos’ pioneering work on the development of the “ordinary” suburb, no attempt has been made to provide an overall statistical framework of estates and builders for Victorian London, into which case studies such as this may be fitted, and there are precious few studies of individual suburbs with which to compare Battersea.
Chapter 5 examines housebuilding trends and building cycles in Victorian Battersea and how it resembles and differs from the wider London pattern. Different aspects of land and property values are also analysed, as are the relationships between the chronology of estates and their distance from Central London, both absolute and relative to neighbouring estates. Chapter 6 presents quantitative evidence for those involved in the actual building of Battersea. Where possible, biographical information is included, together with data on how operations were financed. The patchy sources and the absence of large-scale operators like Thomas Cubitt and Edward Yates, inevitably mean that this is far from complete, although the basic principles are clear enough.
Chapter 7 presents a typology of estates, based on those responsible for initiating development, which is compared with other attempts to break down the complexity of the urbanisation process. Selected examples are discussed in Part III.
Note: Numbers in [ ] are those of the building estate, listed chronologically in Appendix 4.
p. 73
I: Sources
No one source provides information on the number of houses built year by year for the whole period. From 1790 to 1850, the poor rate assessments offer such a sequence, although there are problems with empty houses and “tenements”, and until the late-1830s with the precise location of new houses, and of course no details of builders are given. Between 1845 and 1852, and from 1871, the District Surveyors’ Returns give numbers, location, builders’ names and addresses. Between 1857 and 1870, applications for new houses appear in the District Board of Works minutes, giving some indication of the trend in building, but they are incomplete and do not indicate if the houses were actually built. The rate books once more provide the best indication of development during this period. Drainage plans for many houses survive from the late 1870s onwards, enabling the builders of specific houses to be identified.
To summarise, the sequence of annual figures uses the following sources:
1791-1844 Poor Rate Assessments at the end of the year (usually November), calibrated to the total of occupied and empty houses in the Census 1801-1841.
1845-1852 District Surveyors’ Returns; Census 1851.
1853-1870 Poor Rate Assessments; applications to Wandsworth Board of Works (from 1857) are used for comparison only, as they understate the number of houses built by up to one-third;
Census 1861/1871.
1871-1915 District Surveyors’ Returns; Census 1881-1911; in the case of flats, actual numbers have been taken from local Directories closest to completion and added into the relevant years – including half-houses erected by the Council in 1903/4, but not other such houses, which are in any case rare in Battersea.
Sources of data on land and property values are similarly diverse. For pre-development land values, the Spencer sale (1835/6) and those associated with the creation of Battersea Park (1853-5) provide the best information. The value of land prior to and after housebuilding is often indicated in auction particulars and leases, notably on freehold land company estates. Foot-frontage values can be derived from details of ground rents and plot sizes in leases. The value of houses comes from sales of leases, freehold sales and auctions, and is found in deeds and in the Builder, and occasionally in the local press. Poor rate assessments give estimated gross rental values between c.1835 and 1870, providing a comprehensive picture of the types of house erected. They have been examined for sample dates.
II: The Building Cycle in Battersea
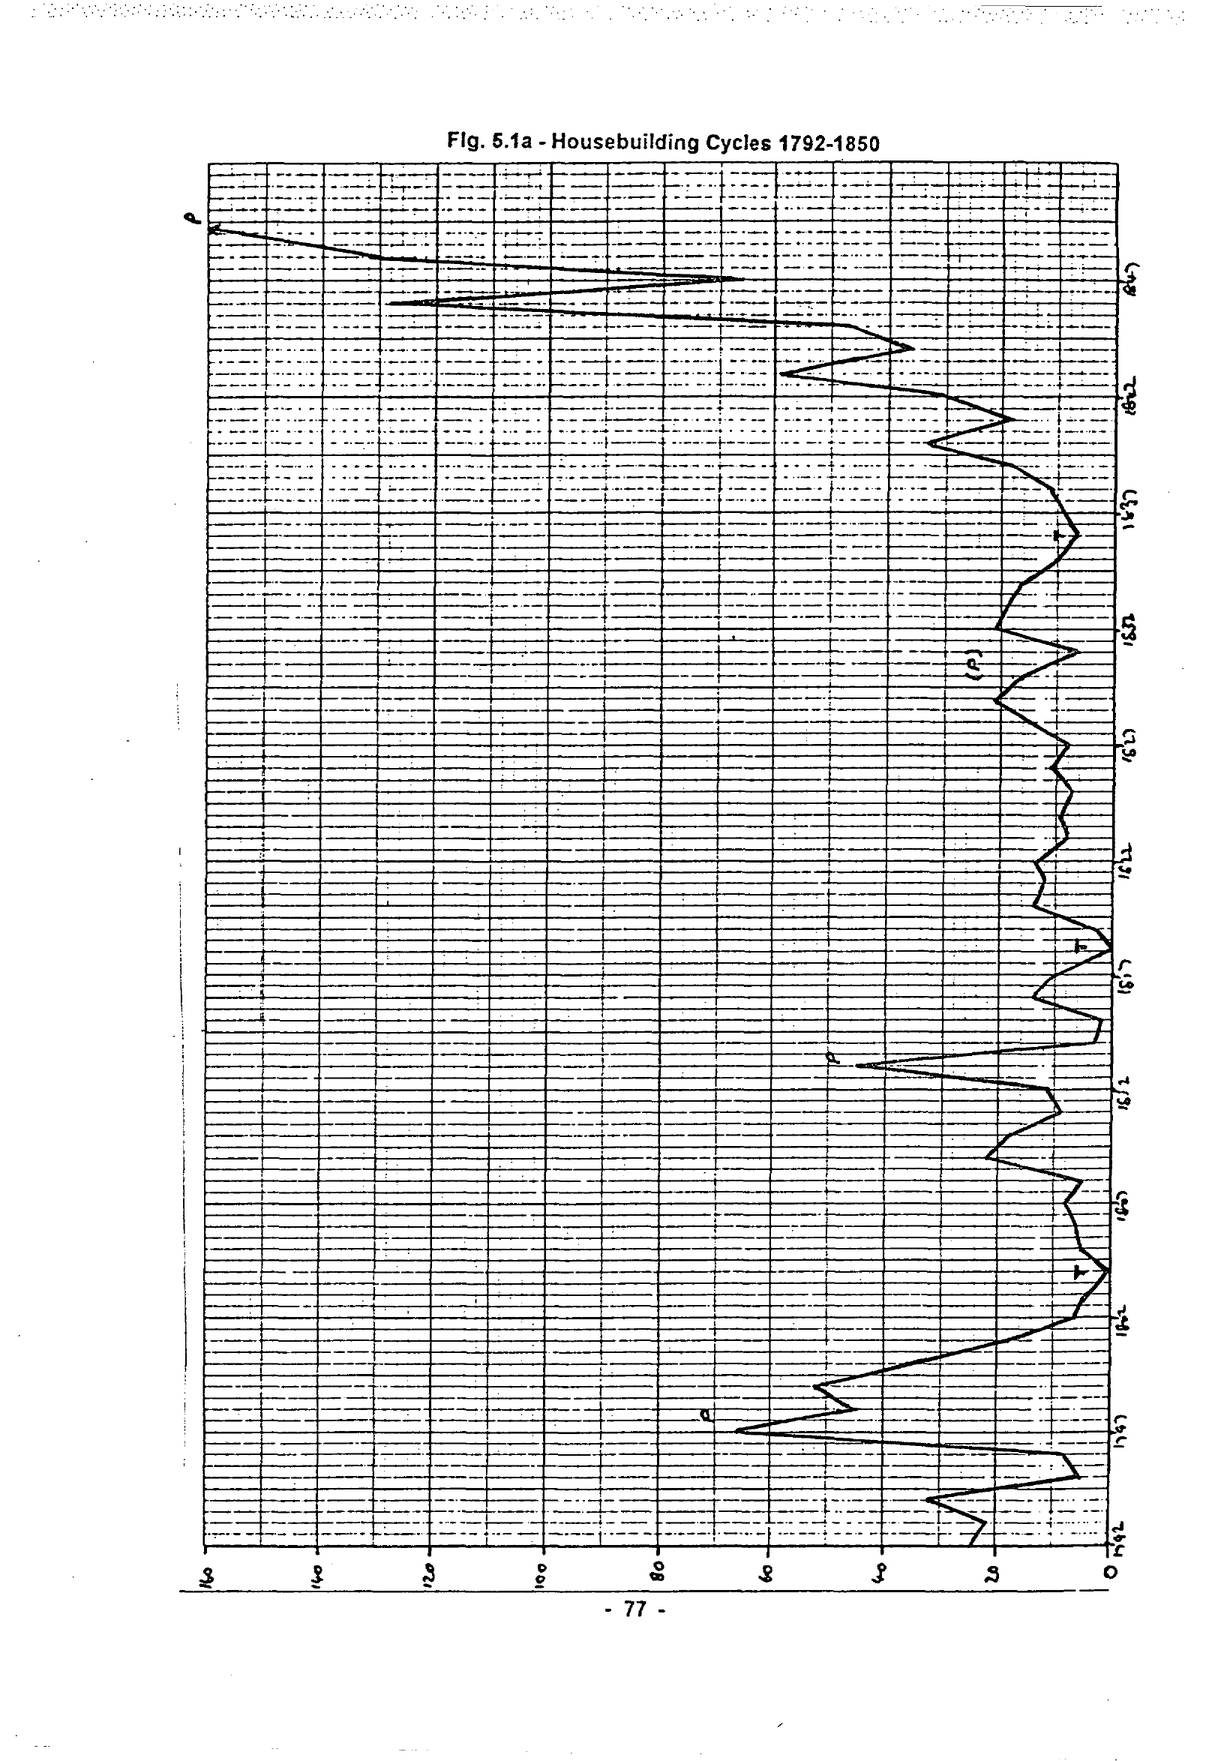
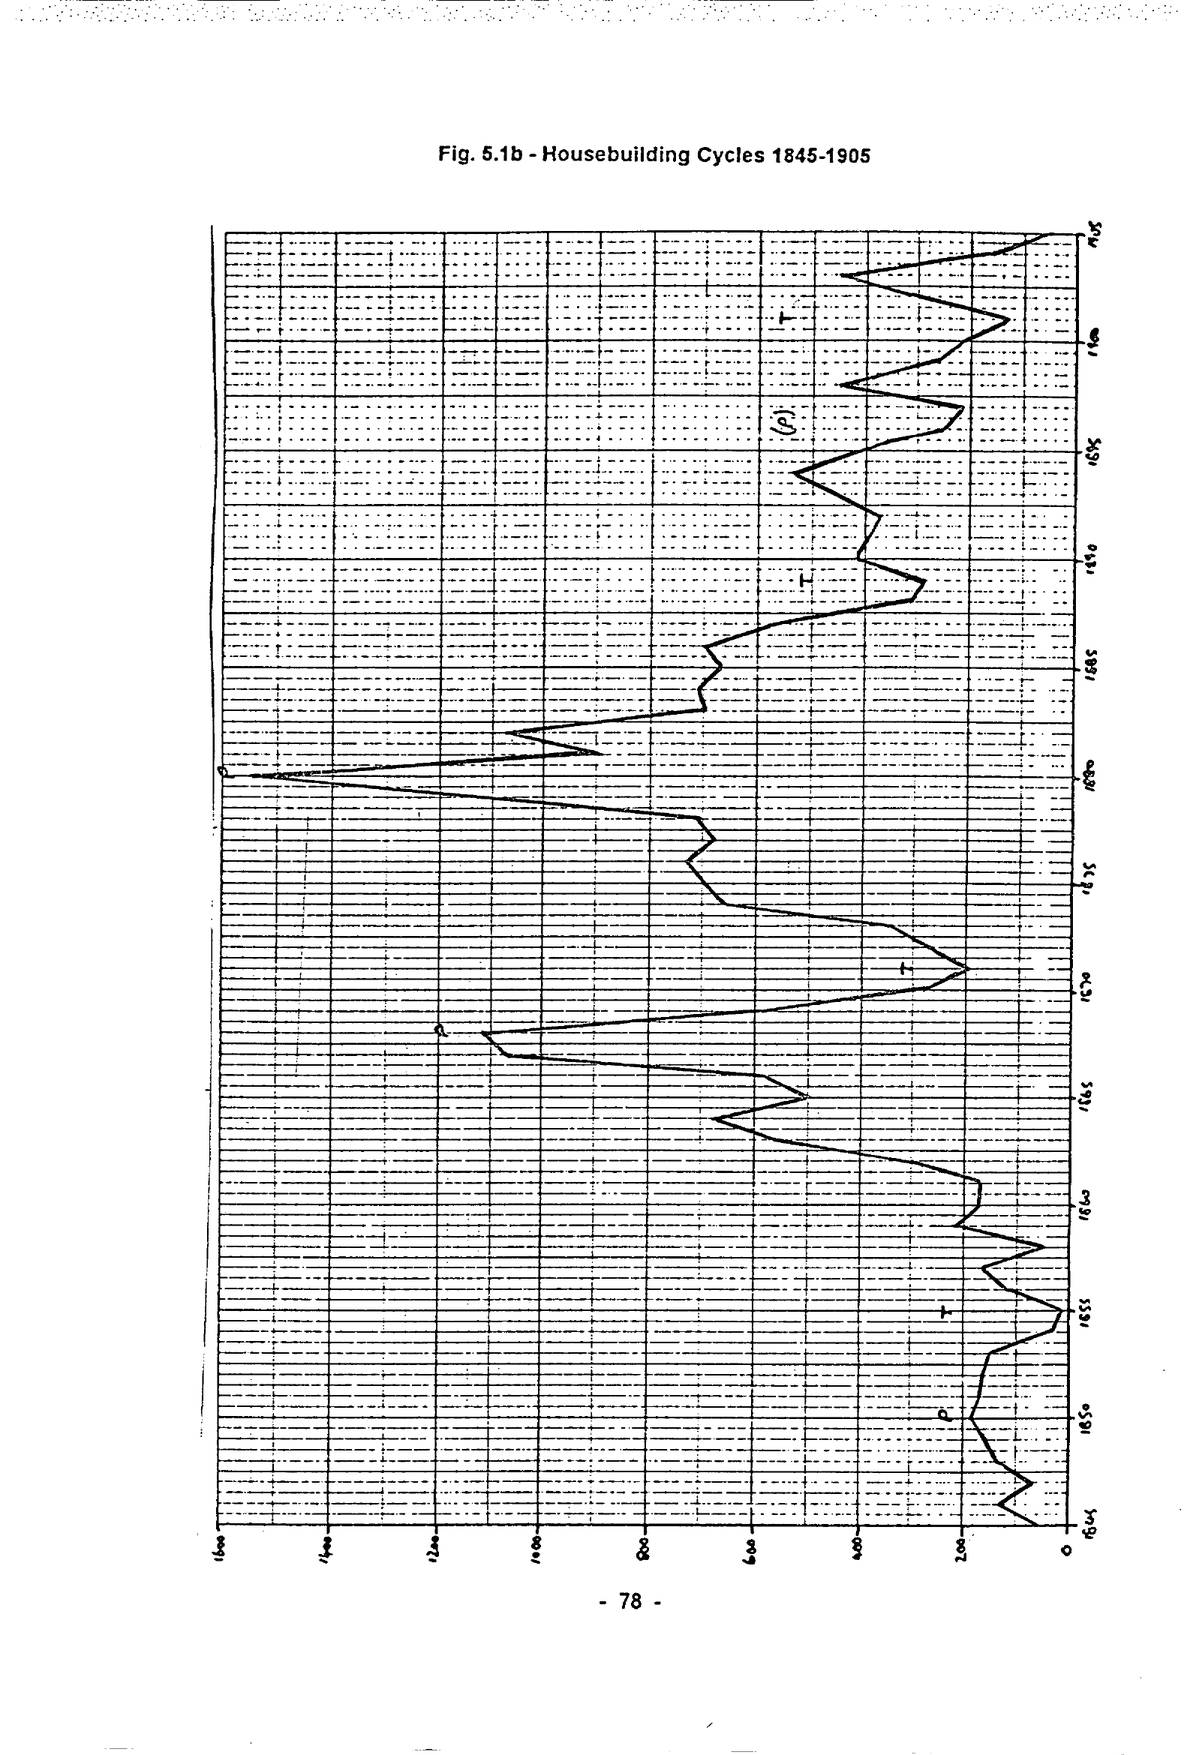
The concept of cycles in economic activity is well known, and within the series of up- and down-swings in the national economy from the early eighteenth century, the building industry has always played a prominent role, both as an agent of change and in response to it. Parry Lewis provides a convenient general treatment of the subject from an economic point of view.1 Table 5.1 sets out annual house output in Battersea, 1791 to 1914, cross-referenced to the Census. (The figures make no allowance for demolition of existing houses, and the total therefore diverges
p. 74progressively from the Census figures.)
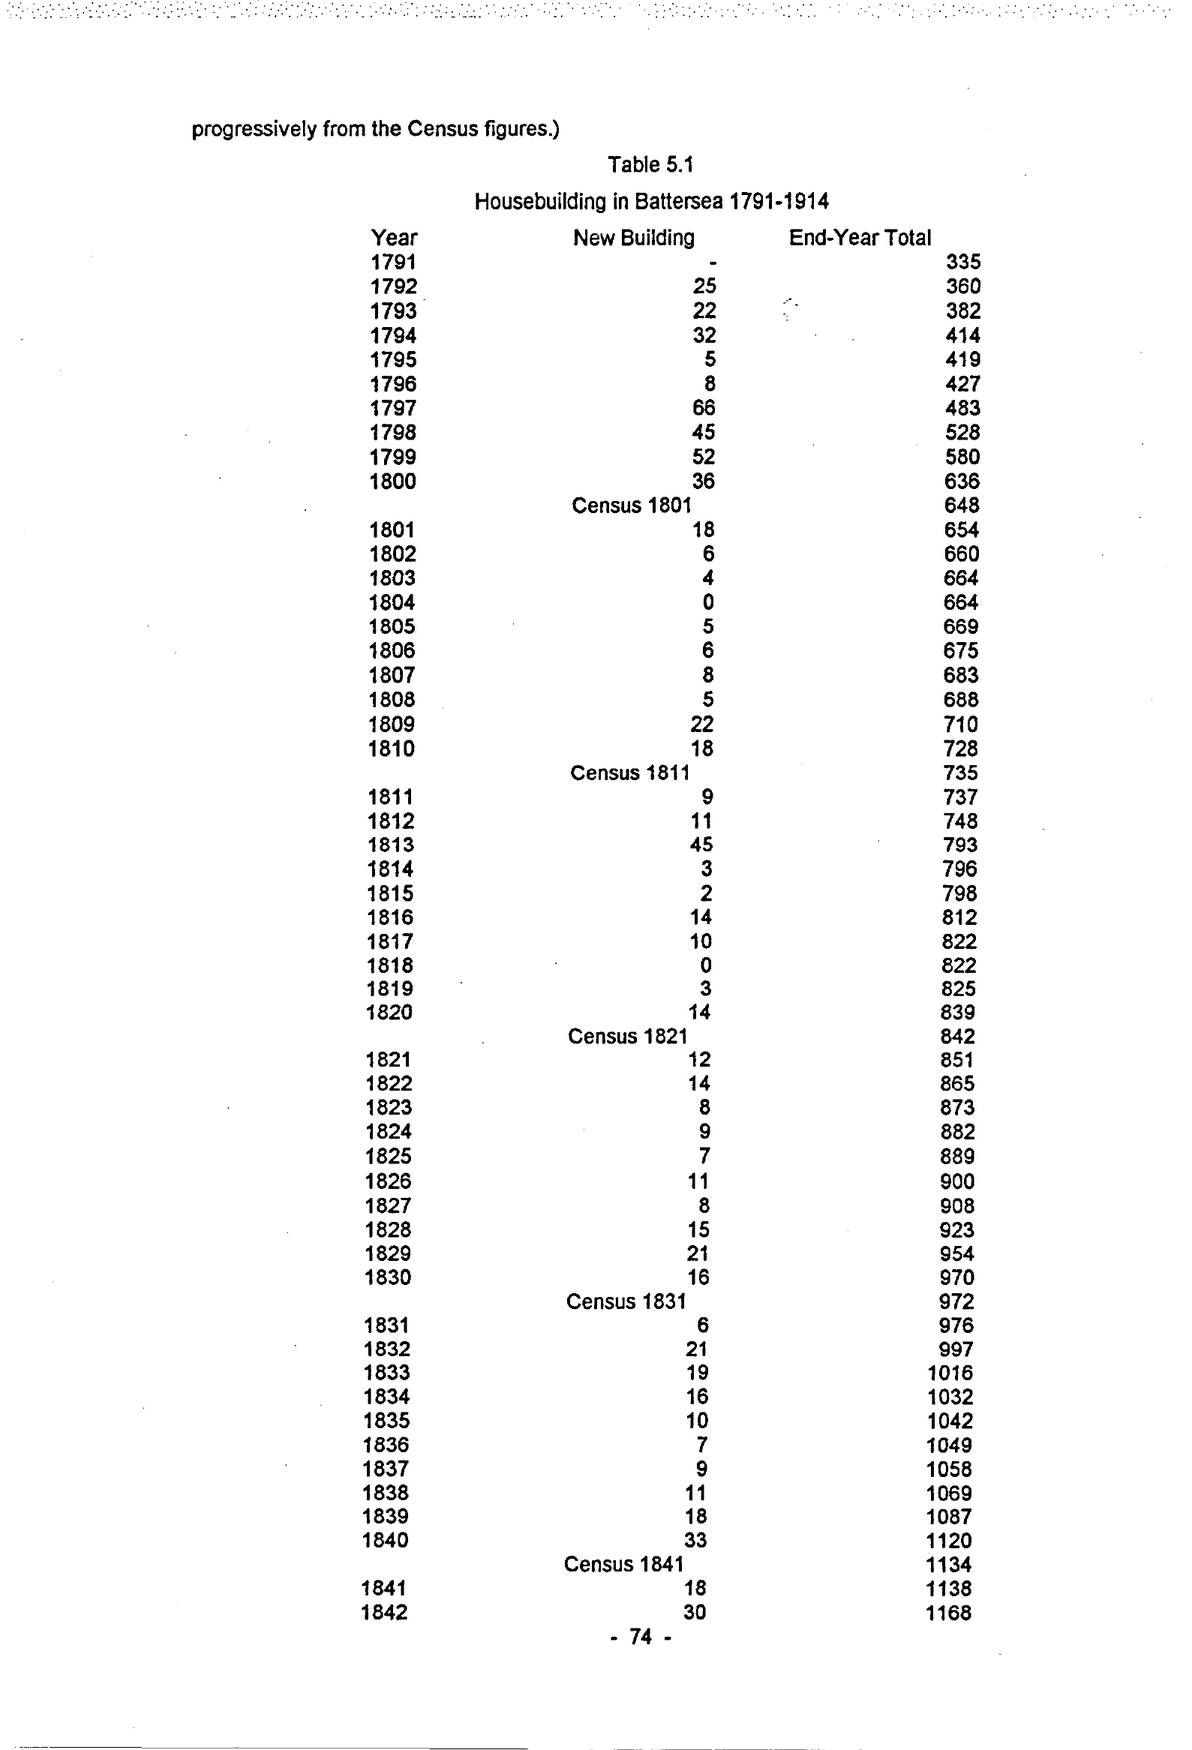
| Year | New Building | End-Year Total |
|---|---|---|
| 1791 | - | 335 |
| 1792 | 25 | 360 |
| 1793 | 22 | 382 |
| 1794 | 32 | 414 |
| 1795 | 5 | 419 |
| 1796 | 8 | 427 |
| 1797 | 66 | 483 |
| 1798 | 45 | 528 |
| 1799 | 52 | 580 |
| 1800 | 36 | 636 |
| Census 1801 | 648 | |
| 1801 | 18 | 654 |
| 1802 | 6 | 660 |
| 1803 | 4 | 664 |
| 1804 | 0 | 664 |
| 1805 | 5 | 669 |
| 1806 | 6 | 675 |
| 1807 | 8 | 683 |
| 1808 | 5 | 688 |
| 1809 | 22 | 710 |
| 1810 | 18 | 728 |
| Census 1811 | 735 | |
| 1811 | 9 | 737 |
| 1812 | 11 | 748 |
| 1813 | 45 | 793 |
| 1814 | 3 | 796 |
| 1815 | 2 | 798 |
| 1816 | 14 | 812 |
| 1817 | 10 | 822 |
| 1818 | 0 | 822 |
| 1819 | 3 | 825 |
| 1820 | 14 | 839 |
| Census 1821 | 842 | |
| 1821 | 12 | 851 |
| 1822 | 14 | 865 |
| 1823 | 8 | 873 |
| 1824 | 9 | 882 |
| 1825 | 7 | 889 |
| 1826 | 11 | 900 |
| 1827 | 8 | 908 |
| 1828 | 15 | 923 |
| 1829 | 21 | 954 |
| 1830 | 16 | 970 |
| Census 1831 | 972 | |
| 1831 | 6 | 976 |
| 1832 | 21 | 997 |
| 1833 | 19 | 1016 |
| 1834 | 16 | 1032 |
| 1835 | 10 | 1042 |
| 1836 | 7 | 1049 |
| 1837 | 9 | 1058 |
| 1838 | 11 | 1069 |
| 1839 | 18 | 1087 |
| 1840 | 33 | 1120 |
| Census 1841 | 1134 | |
| 1841 | 18 | 1138 |
| 1842 | 30 | 1168 |
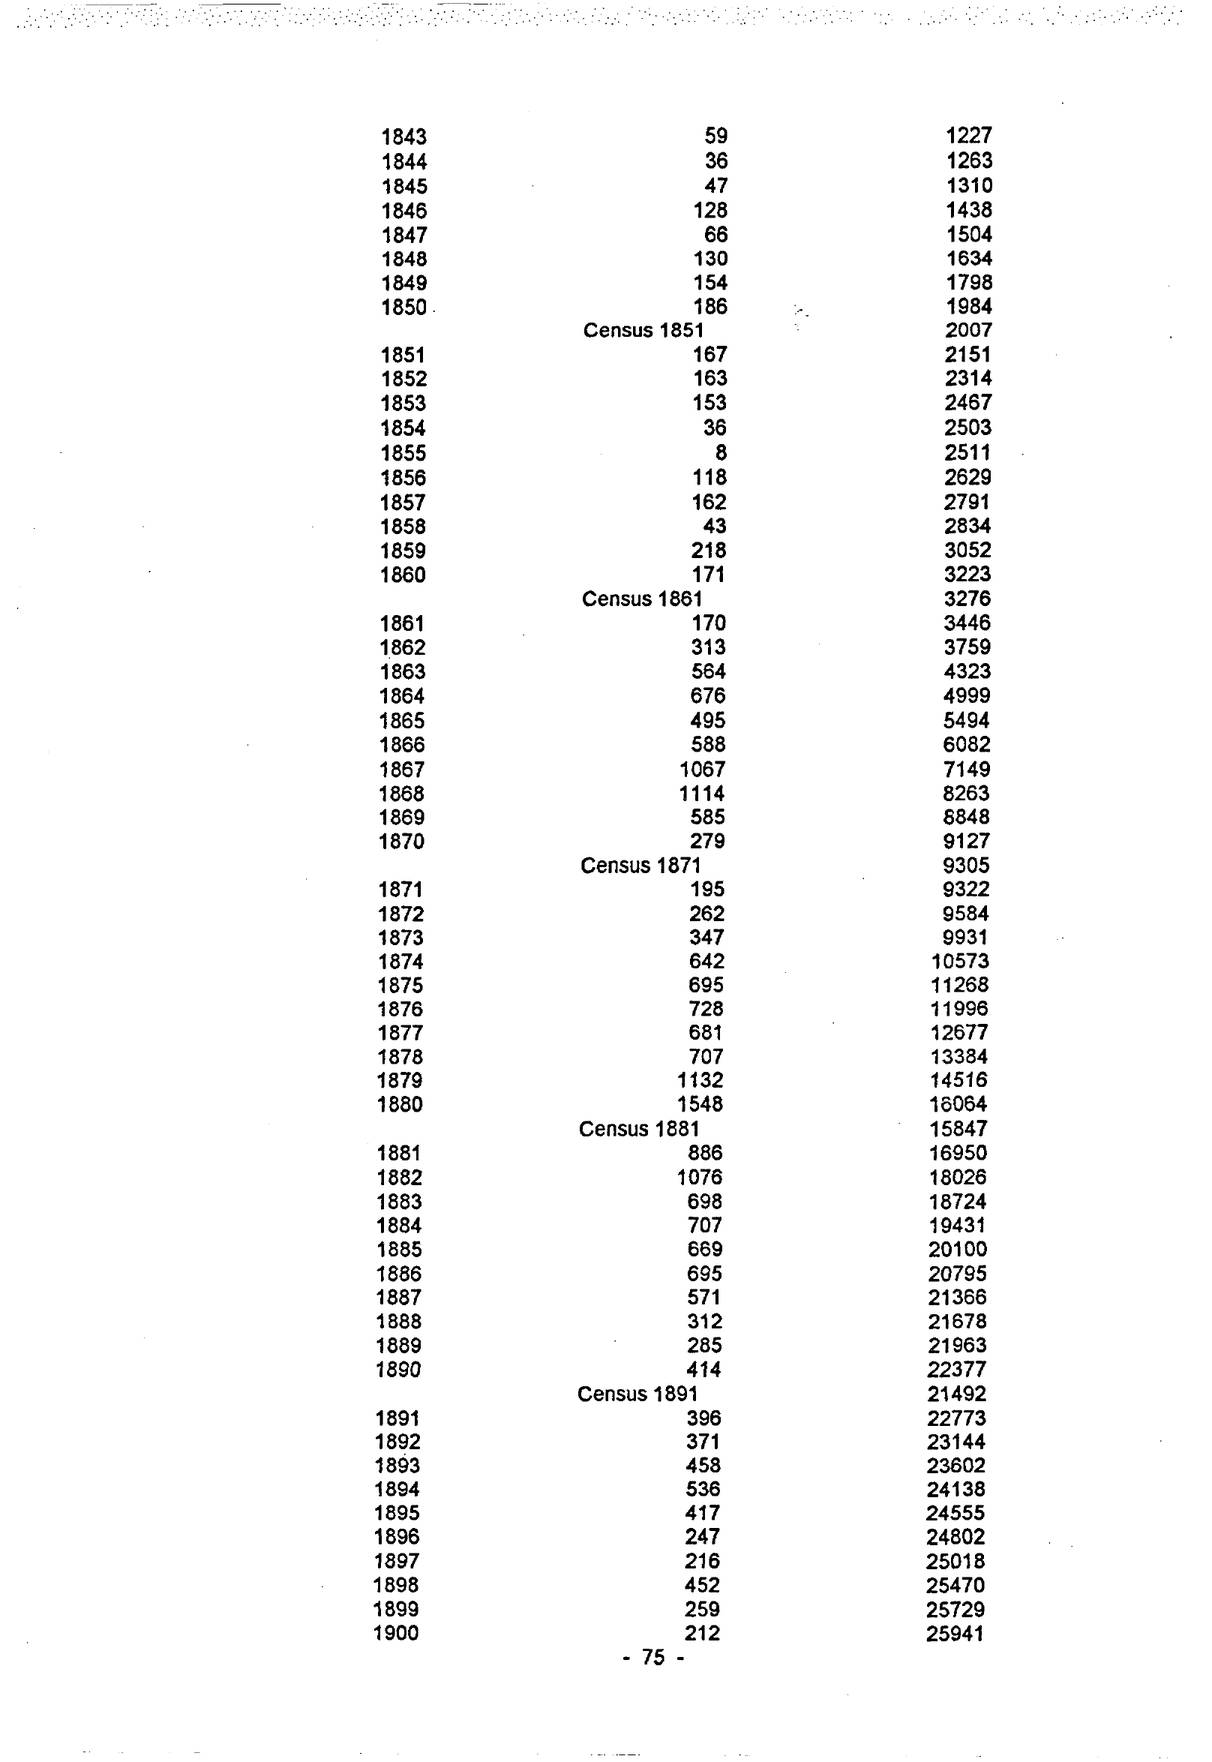
| Year | New Building | End-Year Total |
|---|---|---|
| 1843 | 59 | 1227 |
| 1844 | 36 | 1263 |
| 1845 | 47 | 1310 |
| 1846 | 128 | 1438 |
| 1847 | 66 | 1504 |
| 1848 | 130 | 1634 |
| 1849 | 154 | 1798 |
| 1850 | 186 | 1984 |
| Census 1851 | 2007 | |
| 1851 | 167 | 2151 |
| 1852 | 163 | 2314 |
| 1853 | 153 | 2467 |
| 1854 | 36 | 2503 |
| 1855 | 8 | 2511 |
| 1856 | 118 | 2629 |
| 1857 | 162 | 2791 |
| 1858 | 43 | 2834 |
| 1859 | 218 | 3052 |
| 1860 | 171 | 3223 |
| Census 1861 | 3276 | |
| 1861 | 170 | 3446 |
| 1862 | 313 | 3759 |
| 1863 | 564 | 4323 |
| 1864 | 676 | 4999 |
| 1865 | 495 | 5494 |
| 1866 | 588 | 6082 |
| 1867 | 1067 | 7149 |
| 1868 | 1114 | 8263 |
| 1869 | 585 | 8848 |
| 1870 | 279 | 9127 |
| Census 1871 | 9305 | |
| 1871 | 195 | 9322 |
| 1872 | 262 | 9584 |
| 1873 | 347 | 9931 |
| 1874 | 642 | 10573 |
| 1875 | 695 | 11268 |
| 1876 | 728 | 11996 |
| 1877 | 681 | 12677 |
| 1878 | 707 | 13384 |
| 1879 | 1132 | 14516 |
| 1880 | 1548 | 16064 |
| Census 1881 | 15847 | |
| 1881 | 886 | 16950 |
| 1882 | 1076 | 18026 |
| 1883 | 698 | 18724 |
| 1884 | 707 | 19431 |
| 1885 | 669 | 20100 |
| 1886 | 695 | 20795 |
| 1887 | 571 | 21366 |
| 1888 | 312 | 21678 |
| 1889 | 285 | 21963 |
| 1890 | 414 | 22377 |
| Census 1891 | 21492 | |
| 1891 | 396 | 22773 |
| 1892 | 371 | 23144 |
| 1893 | 458 | 23602 |
| 1894 | 536 | 24138 |
| 1895 | 417 | 24555 |
| 1896 | 247 | 24802 |
| 1897 | 216 | 25018 |
| 1898 | 452 | 25470 |
| 1899 | 259 | 25729 |
| 1900 | 212 | 25941 |
Open zoomable view
Open zoomable view
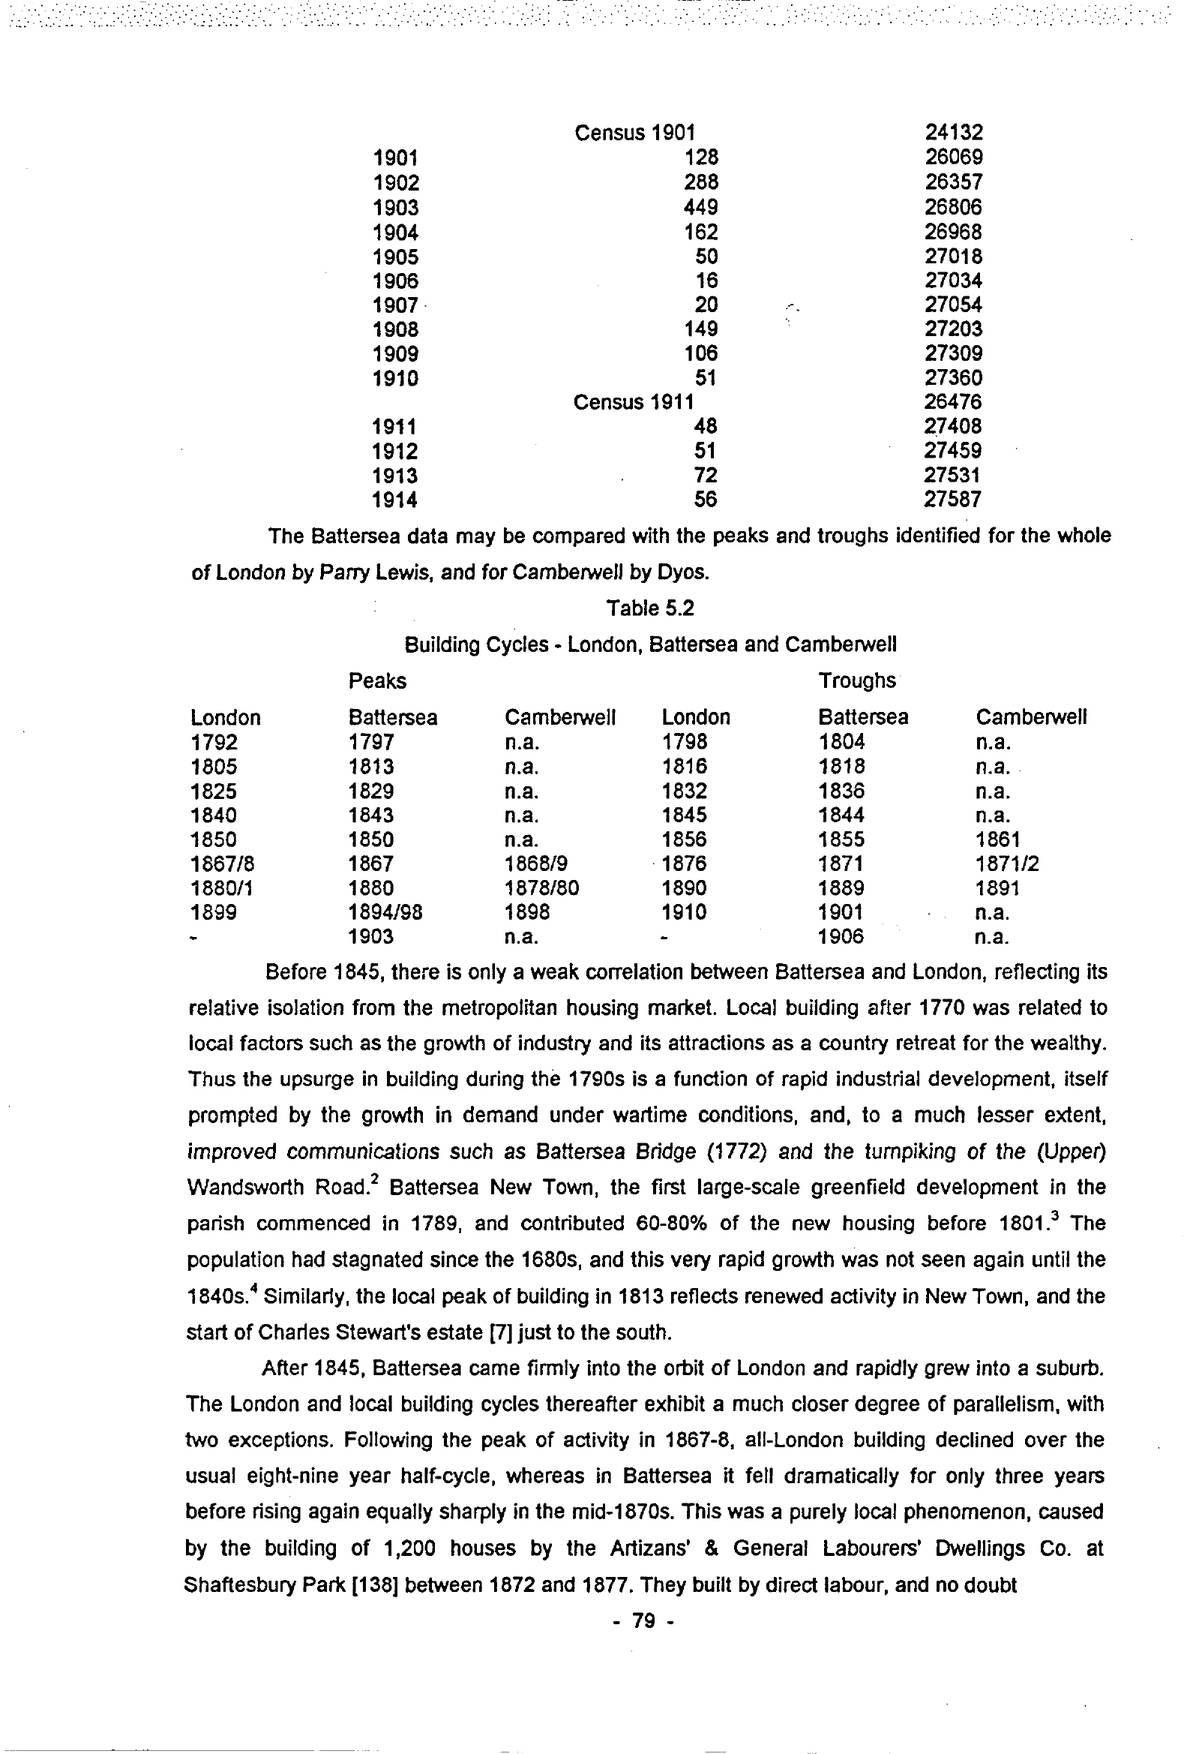
| Year | New Building | End-Year Total |
|---|---|---|
| Census 1901 | 24132 | |
| 1901 | 128 | 26069 |
| 1902 | 288 | 26357 |
| 1903 | 449 | 26806 |
| 1904 | 162 | 26968 |
| 1905 | 50 | 27018 |
| 1906 | 16 | 27034 |
| 1907 | 20 | 27054 |
| 1908 | 149 | 27203 |
| 1909 | 106 | 27309 |
| 1910 | 51 | 27360 |
| Census 1911 | 26476 | |
| 1911 | 48 | 27408 |
| 1912 | 51 | 27459 |
| 1913 | 72 | 27531 |
| 1914 | 56 | 27587 |
The Battersea data may be compared with the peaks and troughs identified for the whole of London by Parry Lewis, and for Camberwell by Dyos.
| Peaks | Troughs | ||||
|---|---|---|---|---|---|
| London | Battersea | Camberwell | London | Battersea | Camberwell |
| 1792 | 1797 | n.a. | 1798 | 1804 | n.a. |
| 1805 | 1813 | n.a. | 1816 | 1818 | n.a. |
| 1825 | 1829 | n.a. | 1832 | 1836 | n.a. |
| 1840 | 1843 | n.a. | 1845 | 1844 | n.a. |
| 1850 | 1850 | n.a. | 1856 | 1855 | 1861 |
| 1867/8 | 1867 | 1868/9 | 1876 | 1871 | 1871/2 |
| 1880/1 | 1880 | 1878/80 | 1890 | 1889 | 1891 |
| 1899 | 1894/98 | 1898 | 1910 | 1901 | n.a. |
| - | 1903 | n.a. | - | 1906 | n.a. |
Before 1845, there is only a weak correlation between Battersea and London, reflecting its relative isolation from the metropolitan housing market. Local building after 1770 was related to local factors such as the growth of industry and its attractions as a country retreat for the wealthy. Thus the upsurge in building during the 1790s is a function of rapid industrial development, itself prompted by the growth in demand under wartime conditions, and, to a much lesser extent, improved communications such as Battersea Bridge (1772) and the turnpiking of the (Upper) Wandsworth Road.2 Battersea New Town, the first large-scale greenfield development in the parish commenced in 1789, and contributed 60-80% of the new housing before 1801.3 The population had stagnated since the 1680s, and this very rapid growth was not seen again until the 1840s.4 Similarly, the local peak of building in 1813 reflects renewed activity in New Town, and the start of Charles Stewart’s estate [7] just to the south.
After 1845, Battersea came firmly into the orbit of London and rapidly grew into a suburb. The London and local building cycles thereafter exhibit a much closer degree of parallelism, with two exceptions. Following the peak of activity in 1867-8, all-London building declined over the usual eight-nine year half-cycle, whereas in Battersea it fell dramatically for only three years before rising again equally sharply in the mid-1870s. This was a purely local phenomenon, caused by the building of 1,200 houses by the Artizans’ & General Labourers’ Dwellings Co. at Shaftesbury Park [138] between 1872 and 1877. They built by direct labour, and no doubt
p. 80achieved considerable economies in land and building costs by building then, using tradesmen who would otherwise have been unemployed. Camberwell also had its peak in 1868-9, falling sharply to a trough in 1871-2.
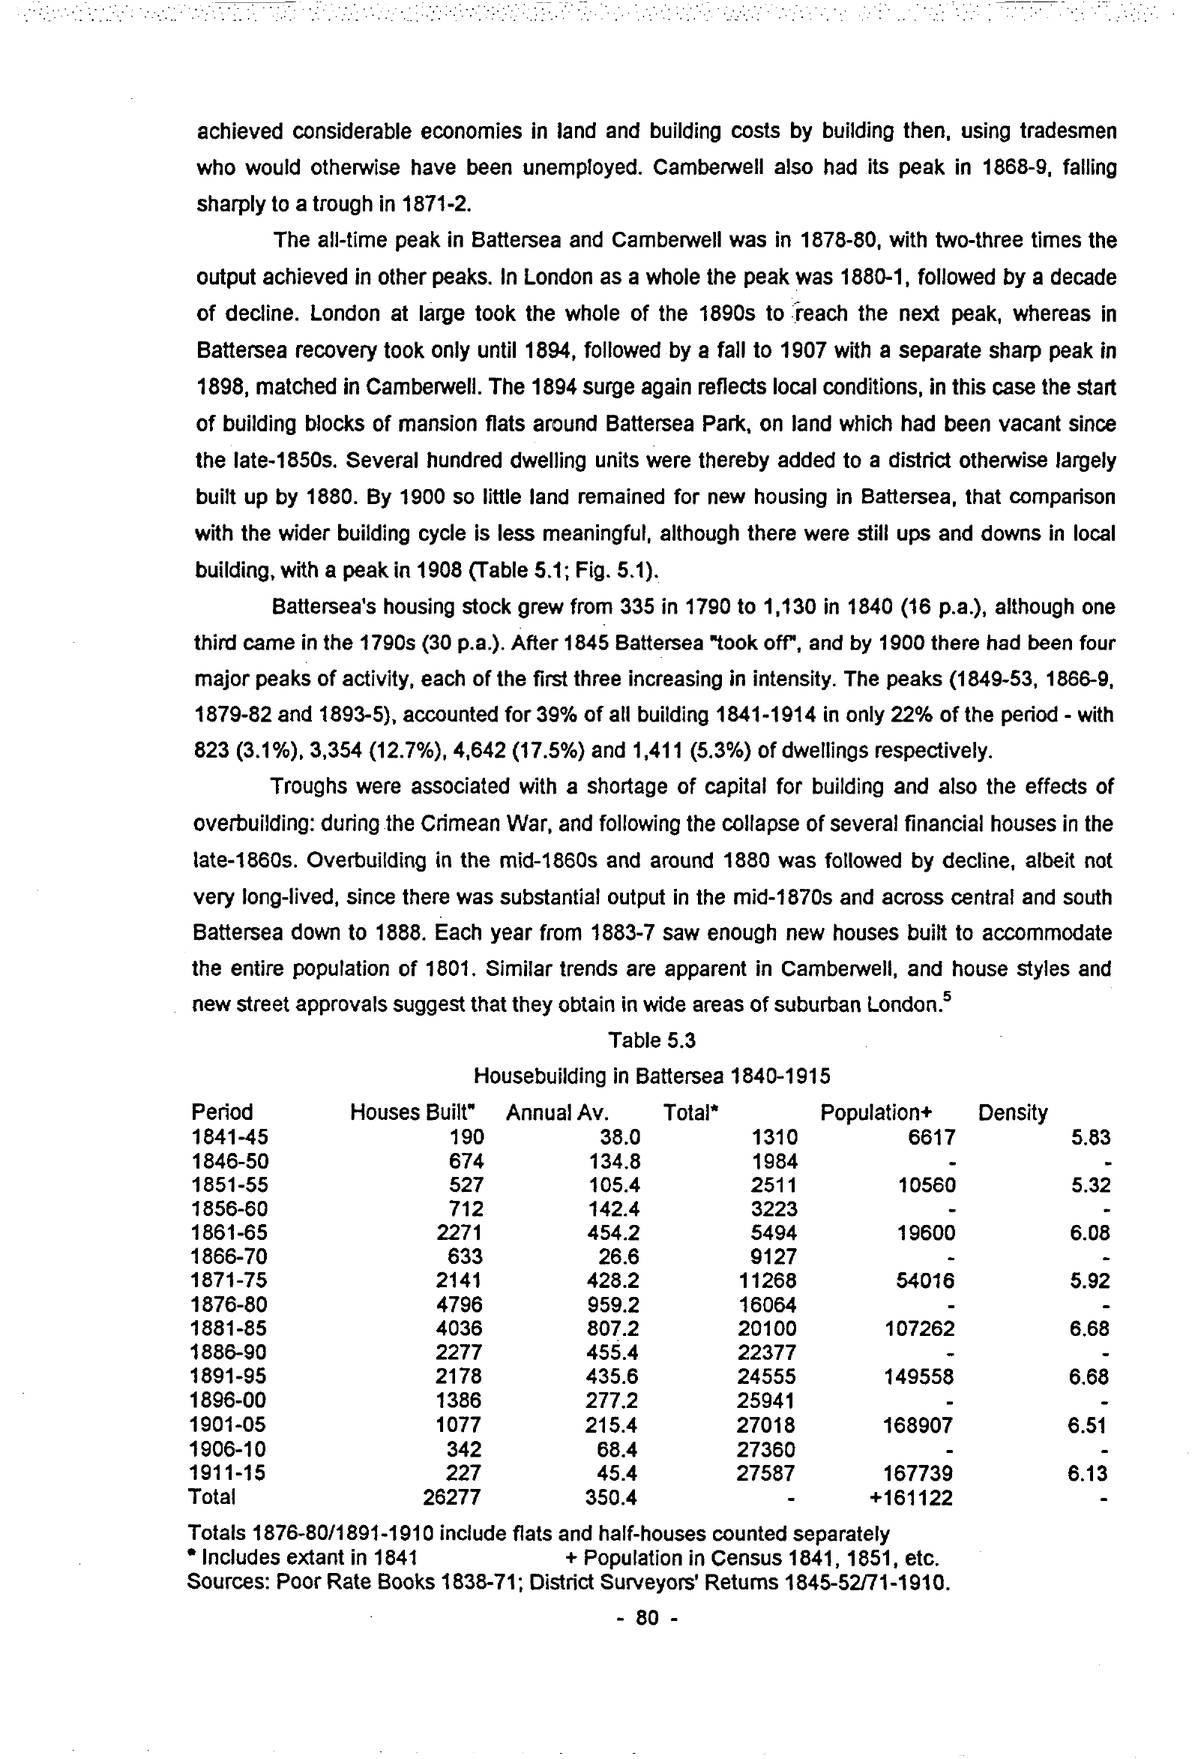
The all-time peak in Battersea and Camberwell was in 1878-80, with two-three times the output achieved in other peaks. In London as a whole the peak was 1880-1, followed by a decade of decline. London at large took the whole of the 1890s to reach the next peak, whereas in Battersea recovery took only until 1894, followed by a fall to 1907 with a separate sharp peak in 1898, matched in Camberwell. The 1894 surge again reflects local conditions, in this case the start of building blocks of mansion flats around Battersea Park, on land which had been vacant since the late-1850s. Several hundred dwelling units were thereby added to a district otherwise largely built up by 1880. By 1900 so little land remained for new housing in Battersea, that comparison with the wider building cycle is less meaningful, although there were still ups and downs in local building, with a peak in 1908 (Table 5.1; Fig. 5.1).
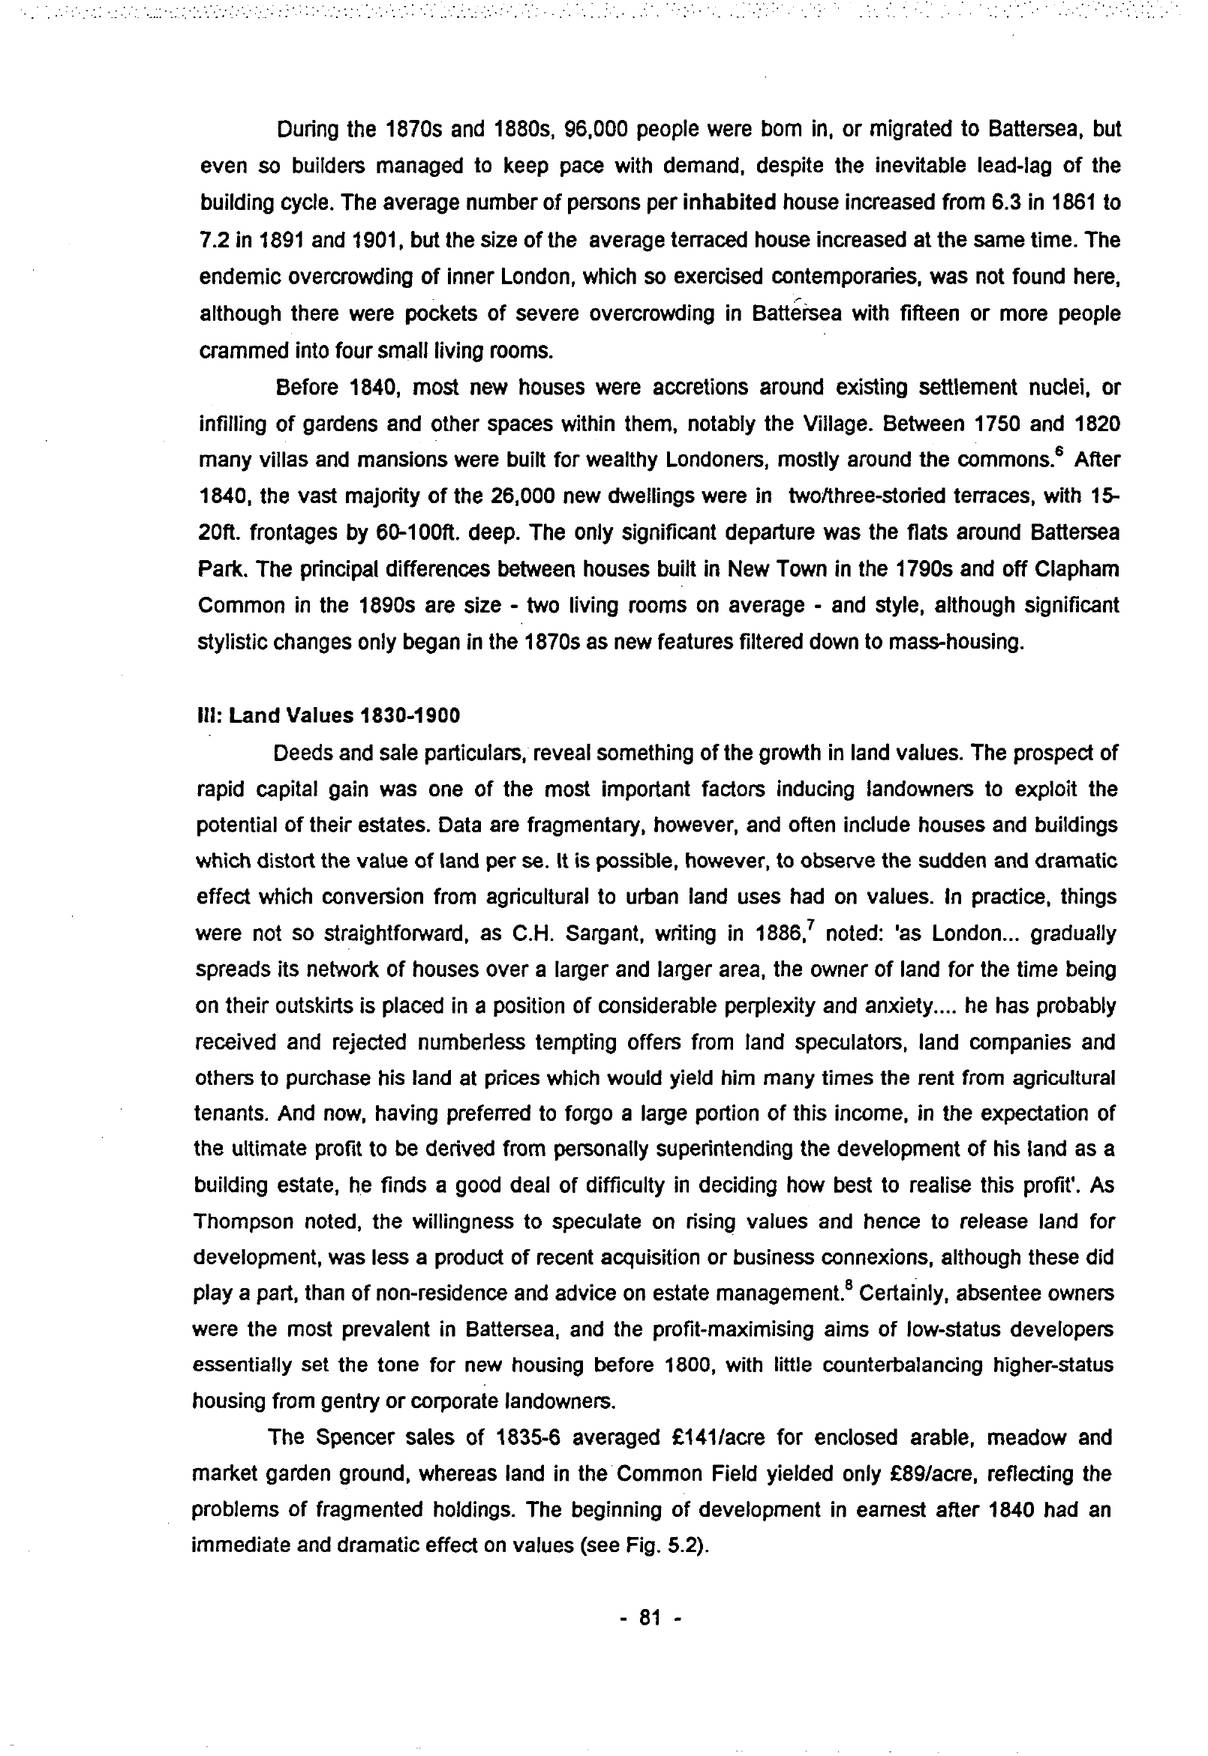
Battersea’s housing stock grew from 335 in 1790 to 1,130 in 1840 (16 p.a.), although one third came in the 1790s (30 p.a.). After 1845 Battersea “took off”, and by 1900 there had been four major peaks of activity, each of the first three increasing in intensity. The peaks (1849-53, 1866-9, 1879-82 and 1893-5), accounted for 39% of all building 1841-1914 in only 22% of the period – with 823 (3.1%), 3,354 (12.7%), 4,642 (17.5%) and 1,411 (5.3%) of dwellings respectively.
Troughs were associated with a shortage of capital for building and also the effects of overbuilding: during the Crimean War, and following the collapse of several financial houses in the late-1860s. Overbuilding in the mid-1860s and around 1880 was followed by decline, albeit not very long-lived, since there was substantial output in the mid-1870s and across central and south Battersea down to 1888. Each year from 1883-7 saw enough new houses built to accommodate the entire population of 1801. Similar trends are apparent in Camberwell, and house styles and new street approvals suggest that they obtain in wide areas of suburban London.5
| Period | Houses Built” | Annual Av. | Total∗ | Population+ | Density |
|---|---|---|---|---|---|
| 1841-45 | 190 | 38.0 | 1310 | 6617 | 5.83 |
| 1846-50 | 674 | 134.8 | 1984 | - | - |
| 1851-55 | 527 | 105.4 | 2511 | 10560 | 5.32 |
| 1856-60 | 712 | 142.4 | 3223 | - | - |
| 1861-65 | 2271 | 454.2 | 5494 | 19600 | 6.08 |
| 1866-70 | 633 | 26.6 | 9127 | - | - |
| 1871-75 | 2141 | 428.2 | 11268 | 54016 | 5.92 |
| 1876-80 | 4796 | 959.2 | 16064 | - | - |
| 1881-85 | 4036 | 807.2 | 20100 | 107262 | 6.68 |
| 1886-90 | 2277 | 455.4 | 22377 | - | - |
| 1891-95 | 2178 | 435.6 | 24555 | 149558 | 6.68 |
| 1896-00 | 1386 | 277.2 | 25941 | - | - |
| 1901-05 | 1077 | 215.4 | 27018 | 168907 | 6.51 |
| 1906-10 | 342 | 68.4 | 27360 | - | - |
| 1911-15 | 227 | 45.4 | 27587 | 167739 | 6.13 |
| Total | 26277 | 350.4 | - | +161122 | - |
Totals 1876-80/1891-1910 include flats and half-houses counted separately
∗ Includes extant in 1841
+ Population in Census 1841, 1851, etc.
Sources: Poor Rate Books 1838-71; District Surveyors’ Returns 1845-52/71-1910.
p. 81During the 1870s and 1880s, 96,000 people were born in, or migrated to Battersea, but even so builders managed to keep pace with demand, despite the inevitable lead-lag of the building cycle. The average number of persons per inhabited house increased from 6.3 in 1861 to 7.2 in 1891 and 1901, but the size of the average terraced house increased at the same time. The endemic overcrowding of inner London, which so exercised contemporaries, was not found here, although there were pockets of severe overcrowding in Battersea with fifteen or more people crammed into four small living rooms.
Before 1840, most new houses were accretions around existing settlement nuclei, or infilling of gardens and other spaces within them, notably the Village. Between 1750 and 1820 many villas and mansions were built for wealthy Londoners, mostly around the commons.6 After 1840, the vast majority of the 26,000 new dwellings were in two/three-storied terraces, with 15-20ft. frontages by 60-100ft. deep. The only significant departure was the flats around Battersea Park. The principal differences between houses built in New Town in the 1790s and off Clapham Common in the 1890s are size – two living rooms on average – and style, although significant stylistic changes only began in the 1870s as new features filtered down to mass-housing.
III: Land Values 1830-1900
Deeds and sale particulars, reveal something of the growth in land values. The prospect of rapid capital gain was one of the most important factors inducing landowners to exploit the potential of their estates. Data are fragmentary, however, and often include houses and buildings which distort the value of land per se. It is possible, however, to observe the sudden and dramatic effect which conversion from agricultural to urban land uses had on values. In practice, things were not so straightforward, as C.H. Sargant, writing in 1886,7 noted: ‘as London... gradually spreads its network of houses over a larger and larger area, the owner of land for the time being on their outskirts is placed in a position of considerable perplexity and anxiety.... he has probably received and rejected numberless tempting offers from land speculators, land companies and others to purchase his land at prices which would yield him many times the rent from agricultural tenants. And now, having preferred to forgo a large portion of this income, in the expectation of the ultimate profit to be derived from personally superintending the development of his land as a building estate, he finds a good deal of difficulty in deciding how best to realise this profit’. As Thompson noted, the willingness to speculate on rising values and hence to release land for development, was less a product of recent acquisition or business connexions, although these did play a part, than of non-residence and advice on estate management.8 Certainly, absentee owners were the most prevalent in Battersea, and the profit-maximising aims of low-status developers essentially set the tone for new housing before 1800, with little counterbalancing higher-status housing from gentry or corporate landowners.
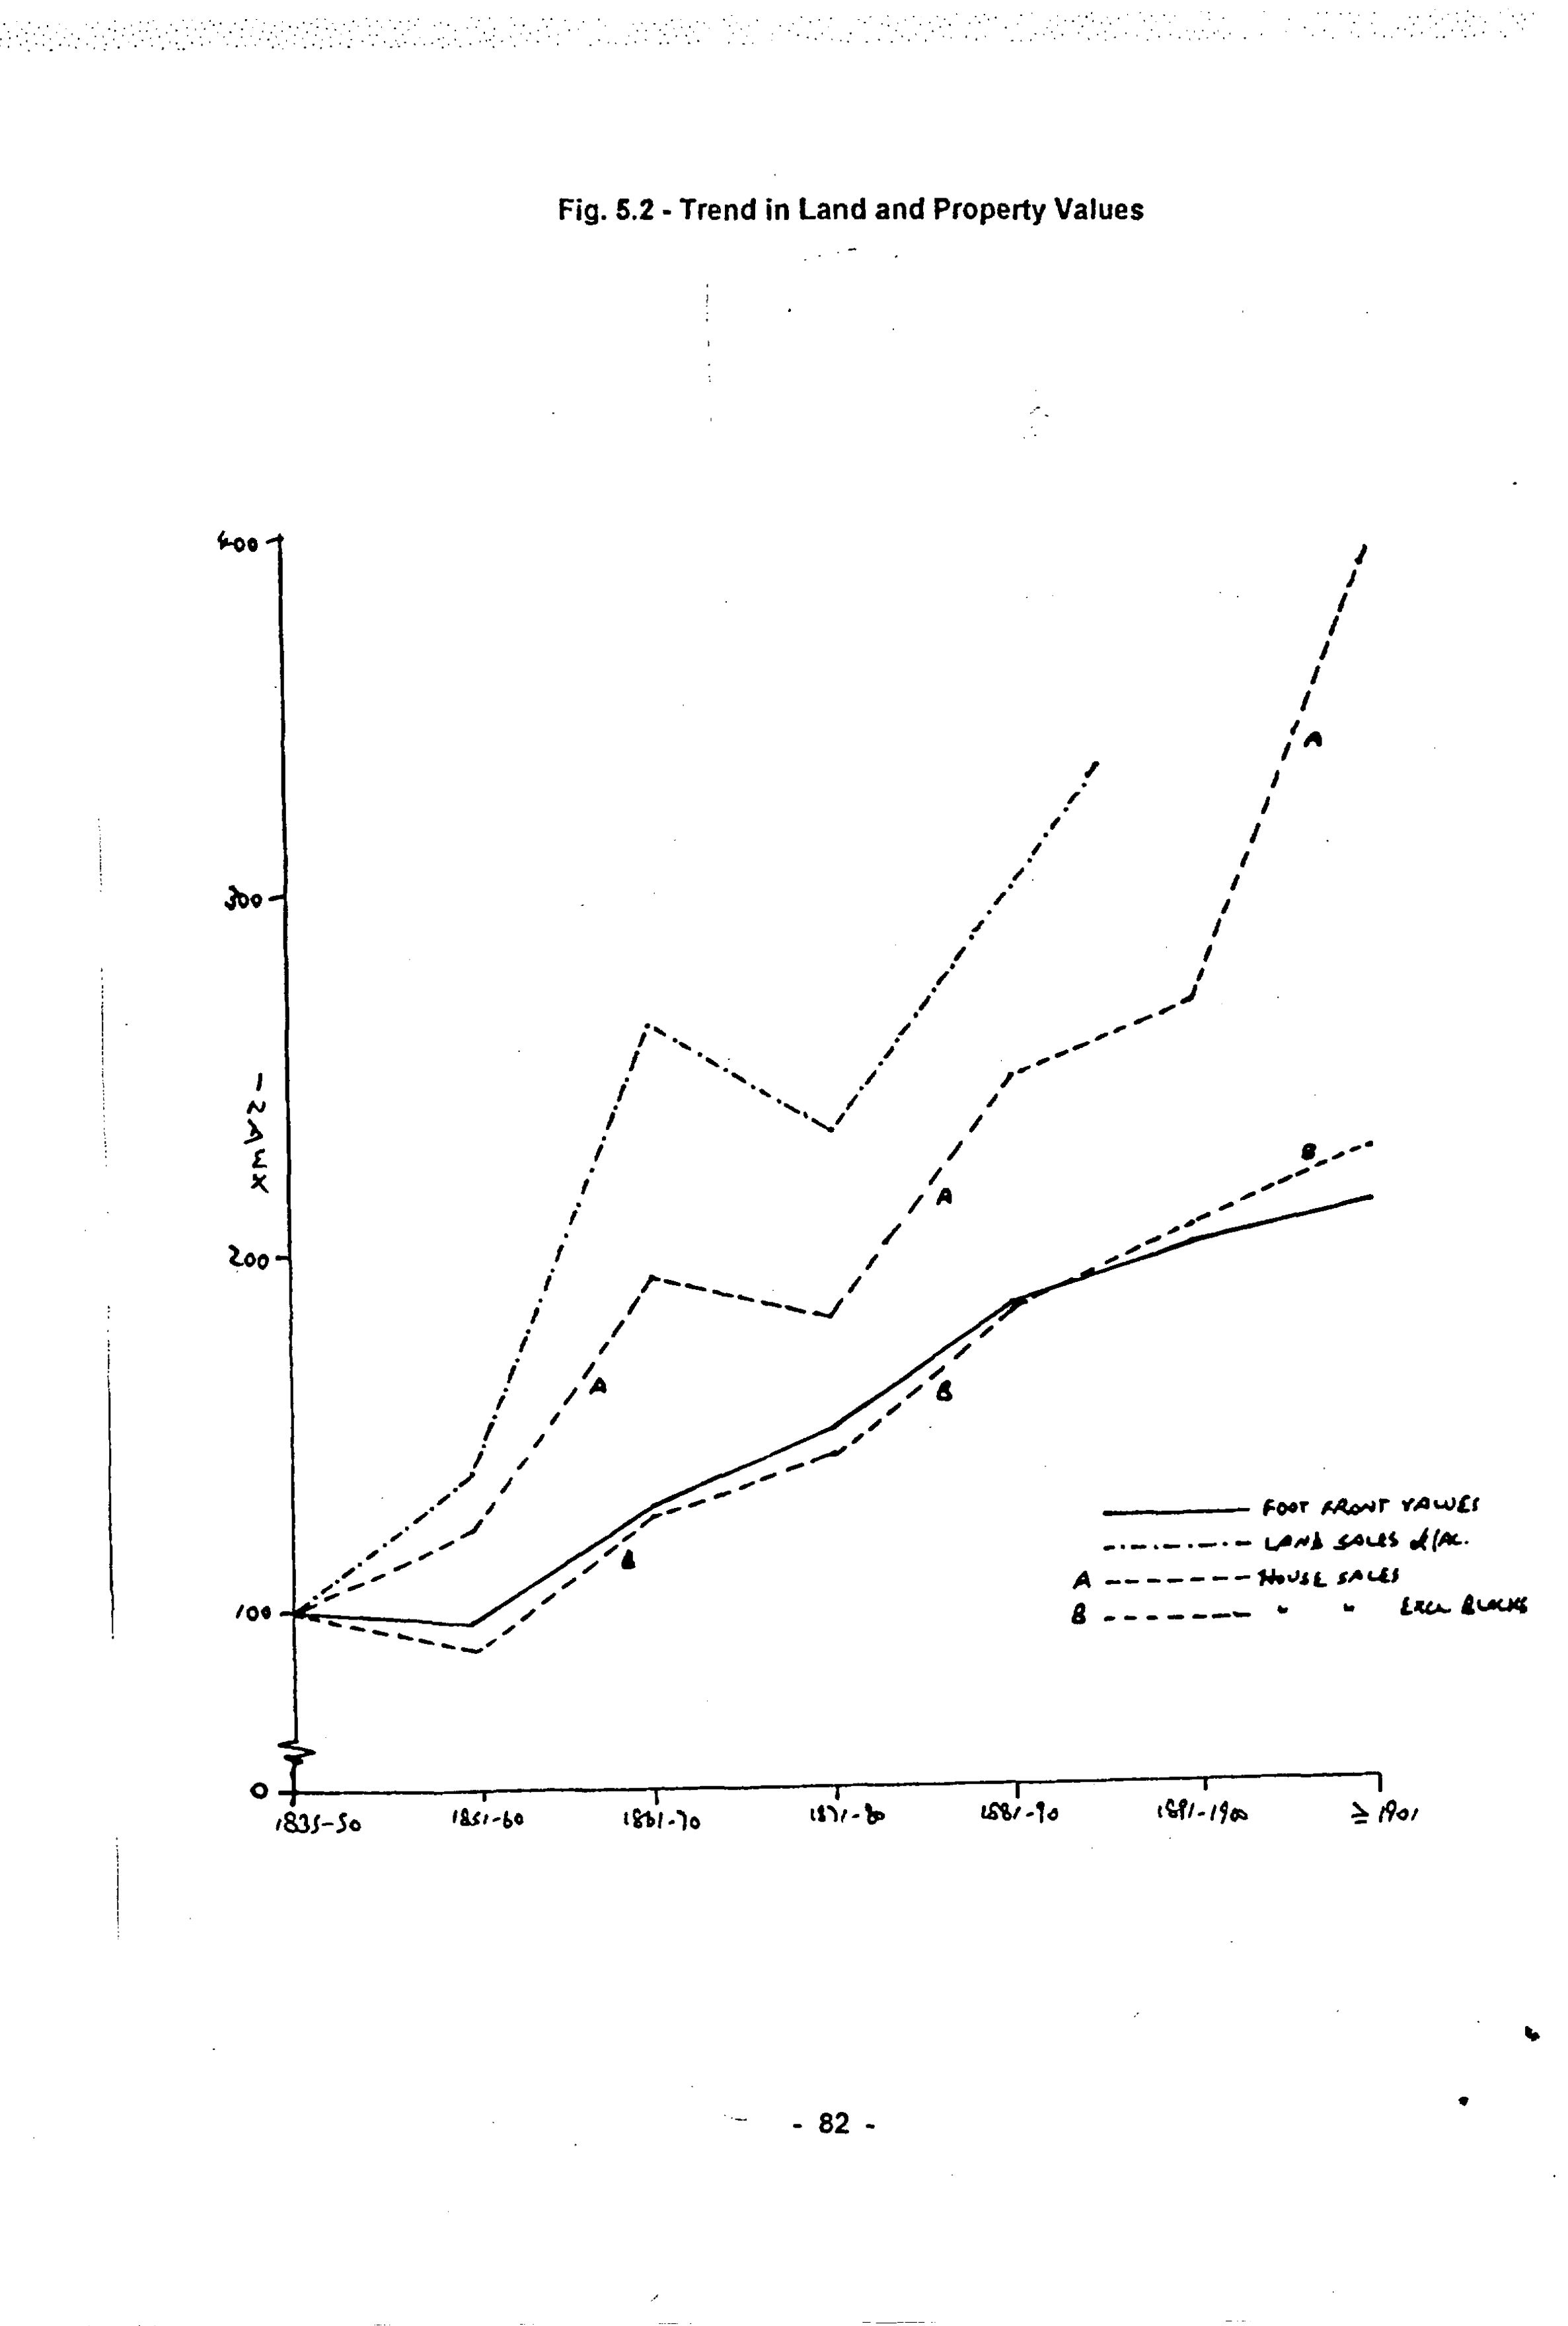
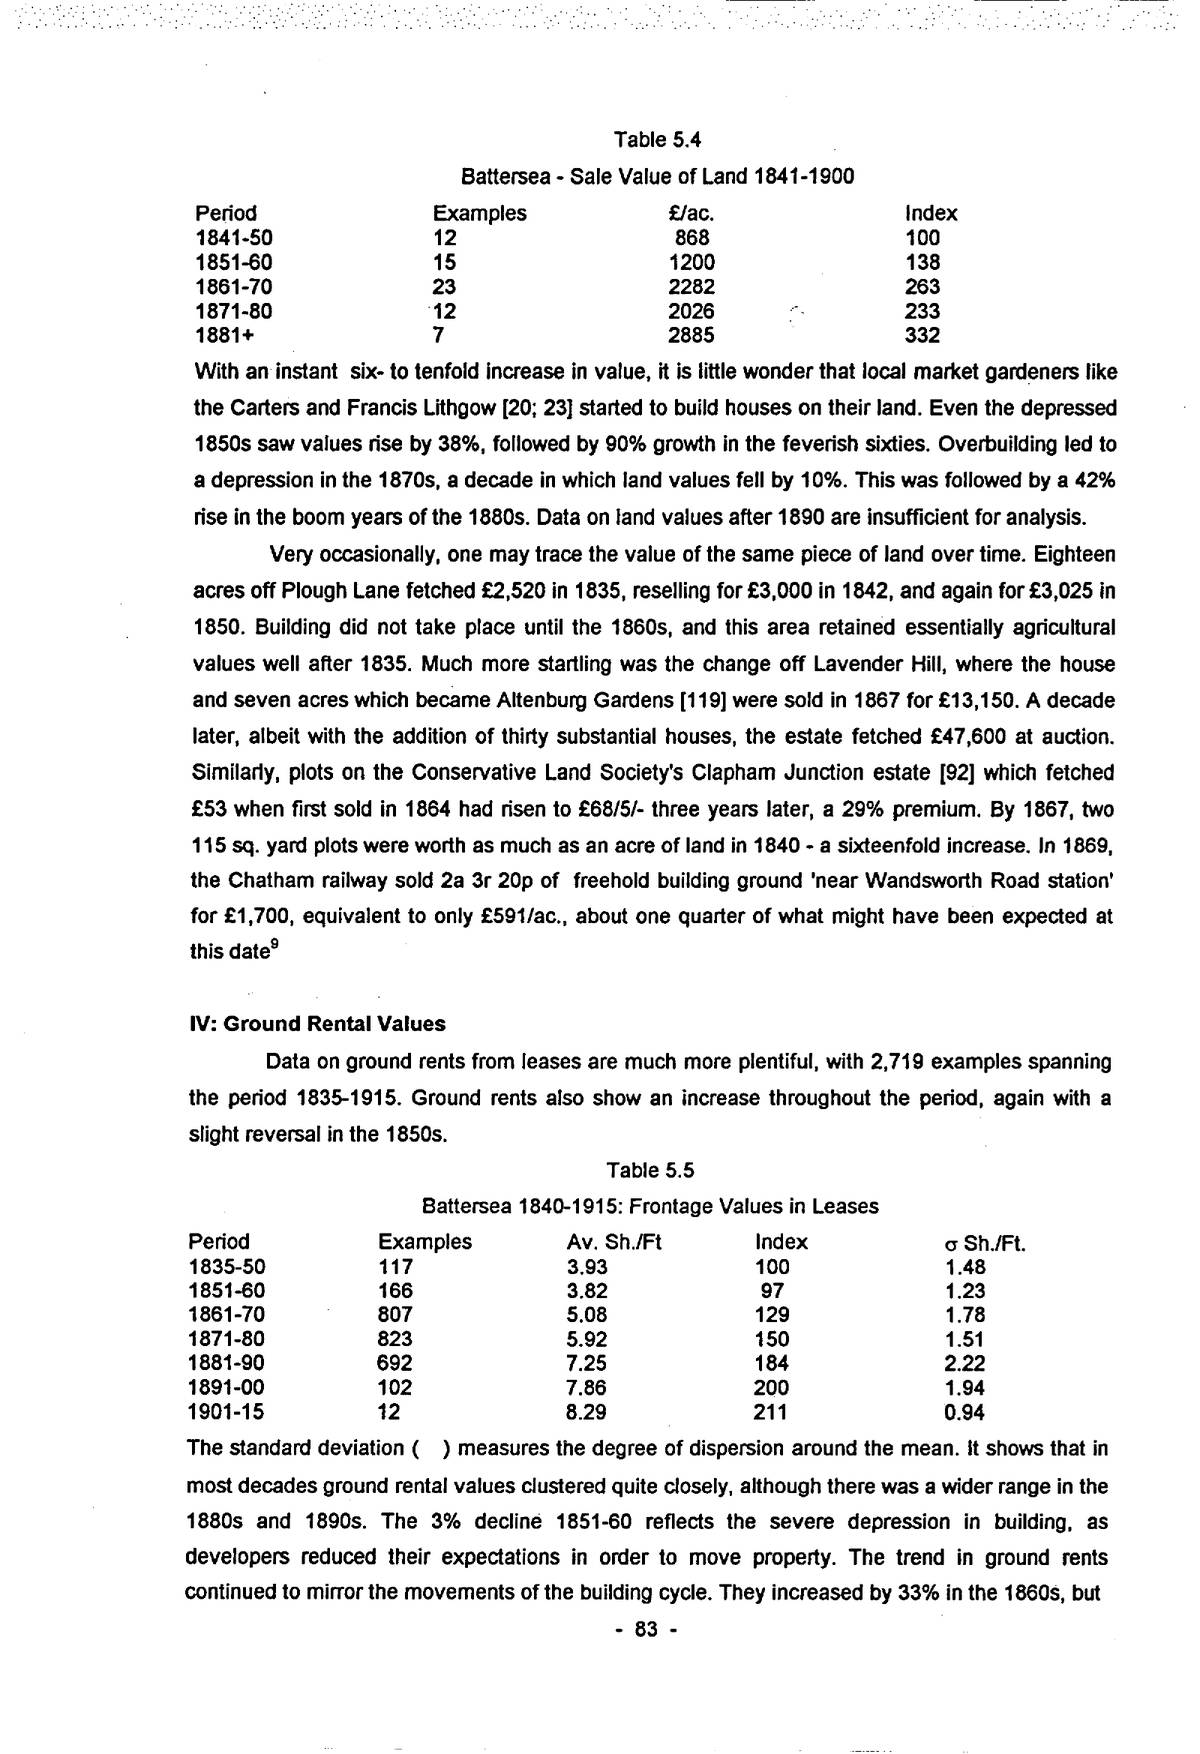
The Spencer sales of 1835-6 averaged £141/acre for enclosed arable, meadow and market garden ground, whereas land in the Common Field yielded only £89/acre, reflecting the problems of fragmented holdings. The beginning of development in earnest after 1840 had an immediate and dramatic effect on values (see Fig. 5.2).
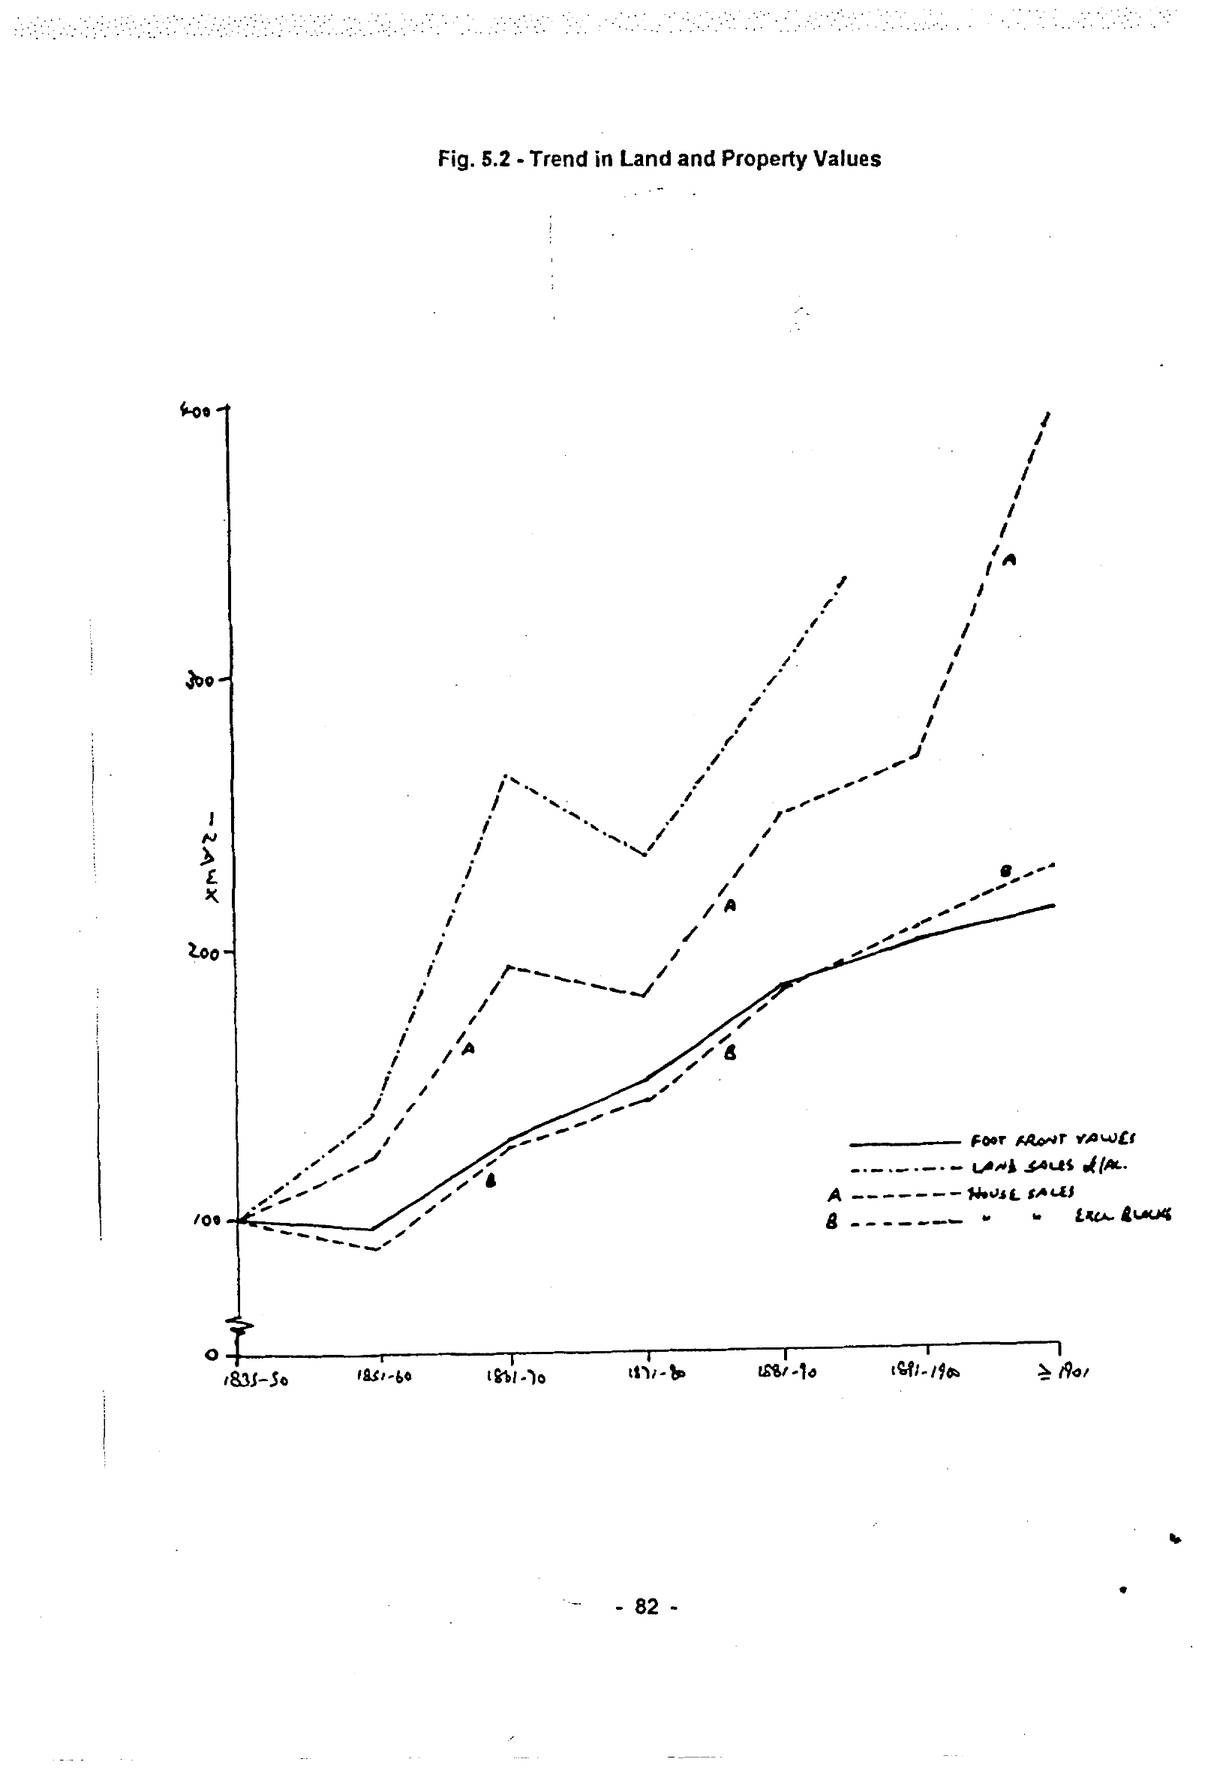
Open zoomable view
| Period | Examples | £/ac. | Index |
|---|---|---|---|
| 1841-50 | 12 | 868 | 100 |
| 1851-60 | 15 | 1200 | 138 |
| 1861-70 | 23 | 2282 | 263 |
| 1871-80 | 12 | 2026 | 233 |
| 1881+ | 7 | 2885 | 332 |
With an instant six- to tenfold increase in value, it is little wonder that local market gardeners like the Carters and Francis Lithgow [20; 23] started to build houses on their land. Even the depressed 1850s saw values rise by 38%, followed by 90% growth in the feverish sixties. Overbuilding led to a depression in the 1870s, a decade in which land values fell by 10%. This was followed by a 42% rise in the boom years of the 1880s. Data on land values after 1890 are insufficient for analysis.
Very occasionally, one may trace the value of the same piece of land over time. Eighteen acres off Plough Lane fetched £2,520 in 1835, reselling for £3,000 in 1842, and again for £3,025 in 1850. Building did not take place until the 1860s, and this area retained essentially agricultural values well after 1835. Much more startling was the change off Lavender Hill, where the house and seven acres which became Altenburg Gardens [119] were sold in 1867 for £13,150. A decade later, albeit with the addition of thirty substantial houses, the estate fetched £47,600 at auction. Similarly, plots on the Conservative Land Society’s Clapham Junction estate [92] which fetched £53 when first sold in 1864 had risen to £68/5/- three years later, a 29% premium. By 1867, two 115 sq. yard plots were worth as much as an acre of land in 1840 – a sixteenfold increase. In 1869, the Chatham railway sold 2a 3r 20p of freehold building ground ‘near Wandsworth Road station’ for £1,700, equivalent to only £591/ac., about one quarter of what might have been expected at this date9
IV: Ground Rental Values
Data on ground rents from leases are much more plentiful, with 2,719 examples spanning the period 1835-1915. Ground rents also show an increase throughout the period, again with a slight reversal in the 1850s.
| Period | Examples | Av. Sh./Ft | Index | σ Sh./Ft. |
|---|---|---|---|---|
| 1835-50 | 117 | 3.93 | 100 | 1.48 |
| 1851-60 | 166 | 3.82 | 97 | 1.23 |
| 1861-70 | 807 | 5.08 | 129 | 1.78 |
| 1871-80 | 823 | 5.92 | 150 | 1.51 |
| 1881-90 | 692 | 7.25 | 184 | 2.22 |
| 1891-00 | 102 | 7.86 | 200 | 1.94 |
| 1901-15 | 12 | 8.29 | 211 | 0.94 |
The standard deviation ( ) measures the degree of dispersion around the mean. It shows that in most decades ground rental values clustered quite closely, although there was a wider range in the 1880s and 1890s. The 3% decline 1851-60 reflects the severe depression in building, as developers reduced their expectations in order to move property. The trend in ground rents continued to mirror the movements of the building cycle. They increased by 33% in the 1860s, but
p. 84only 16% in the depressed 1870s. Rentals rose by 23% in the 1880s. The 1890s were years of lower activity, and rentals grew by only 9%. After 1900, fewer deeds are available, but they confirm the slowing in growth – to 5.5%.
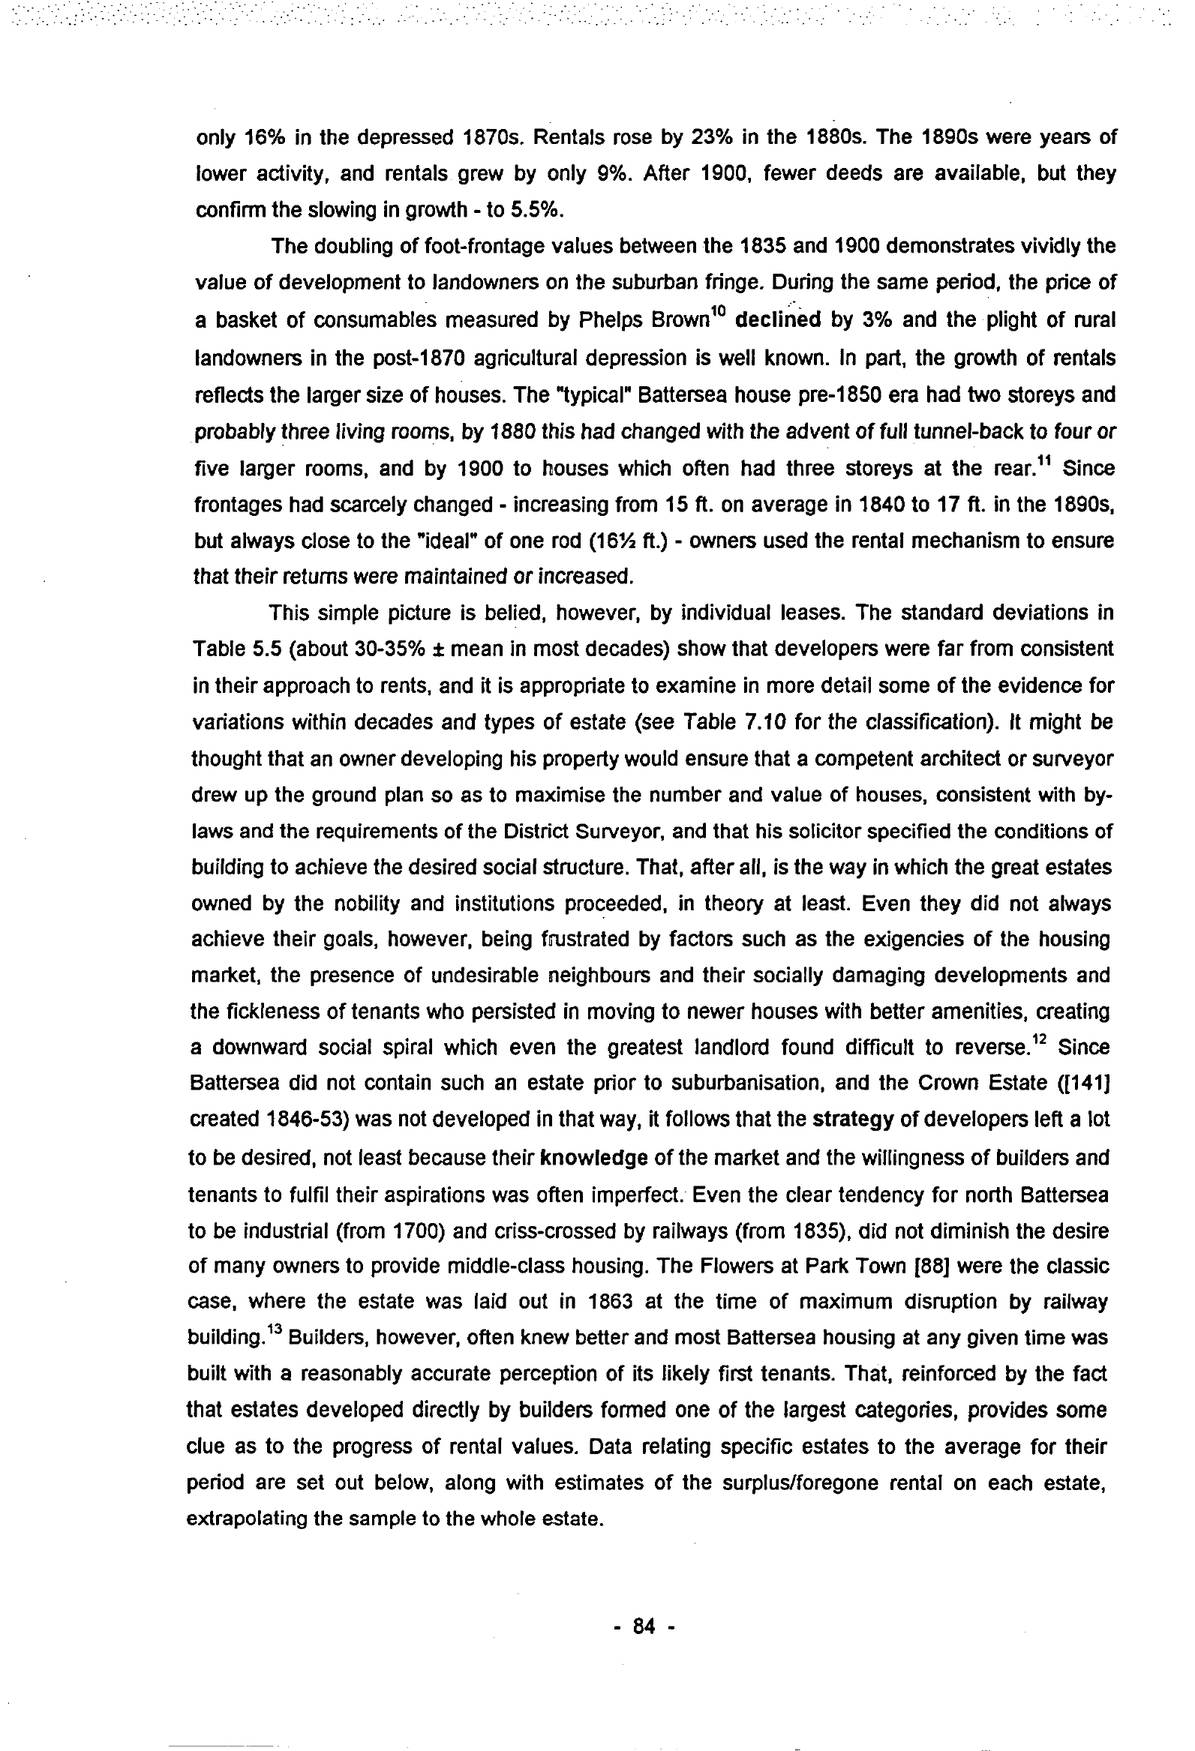
The doubling of foot-frontage values between the 1835 and 1900 demonstrates vividly the value of development to landowners on the suburban fringe. During the same period, the price of a basket of consumables measured by Phelps Brown10 declined by 3% and the plight of rural landowners in the post-1870 agricultural depression is well known. In part, the growth of rentals reflects the larger size of houses. The “typical” Battersea house pre-1850 era had two storeys and probably three living rooms, by 1880 this had changed with the advent of full tunnel-back to four or five larger rooms, and by 1900 to houses which often had three storeys at the rear.11 Since frontages had scarcely changed – increasing from 15 ft. on average in 1840 to 17 ft. in the 1890s, but always close to the “ideal” of one rod (16½ ft.) – owners used the rental mechanism to ensure that their returns were maintained or increased.
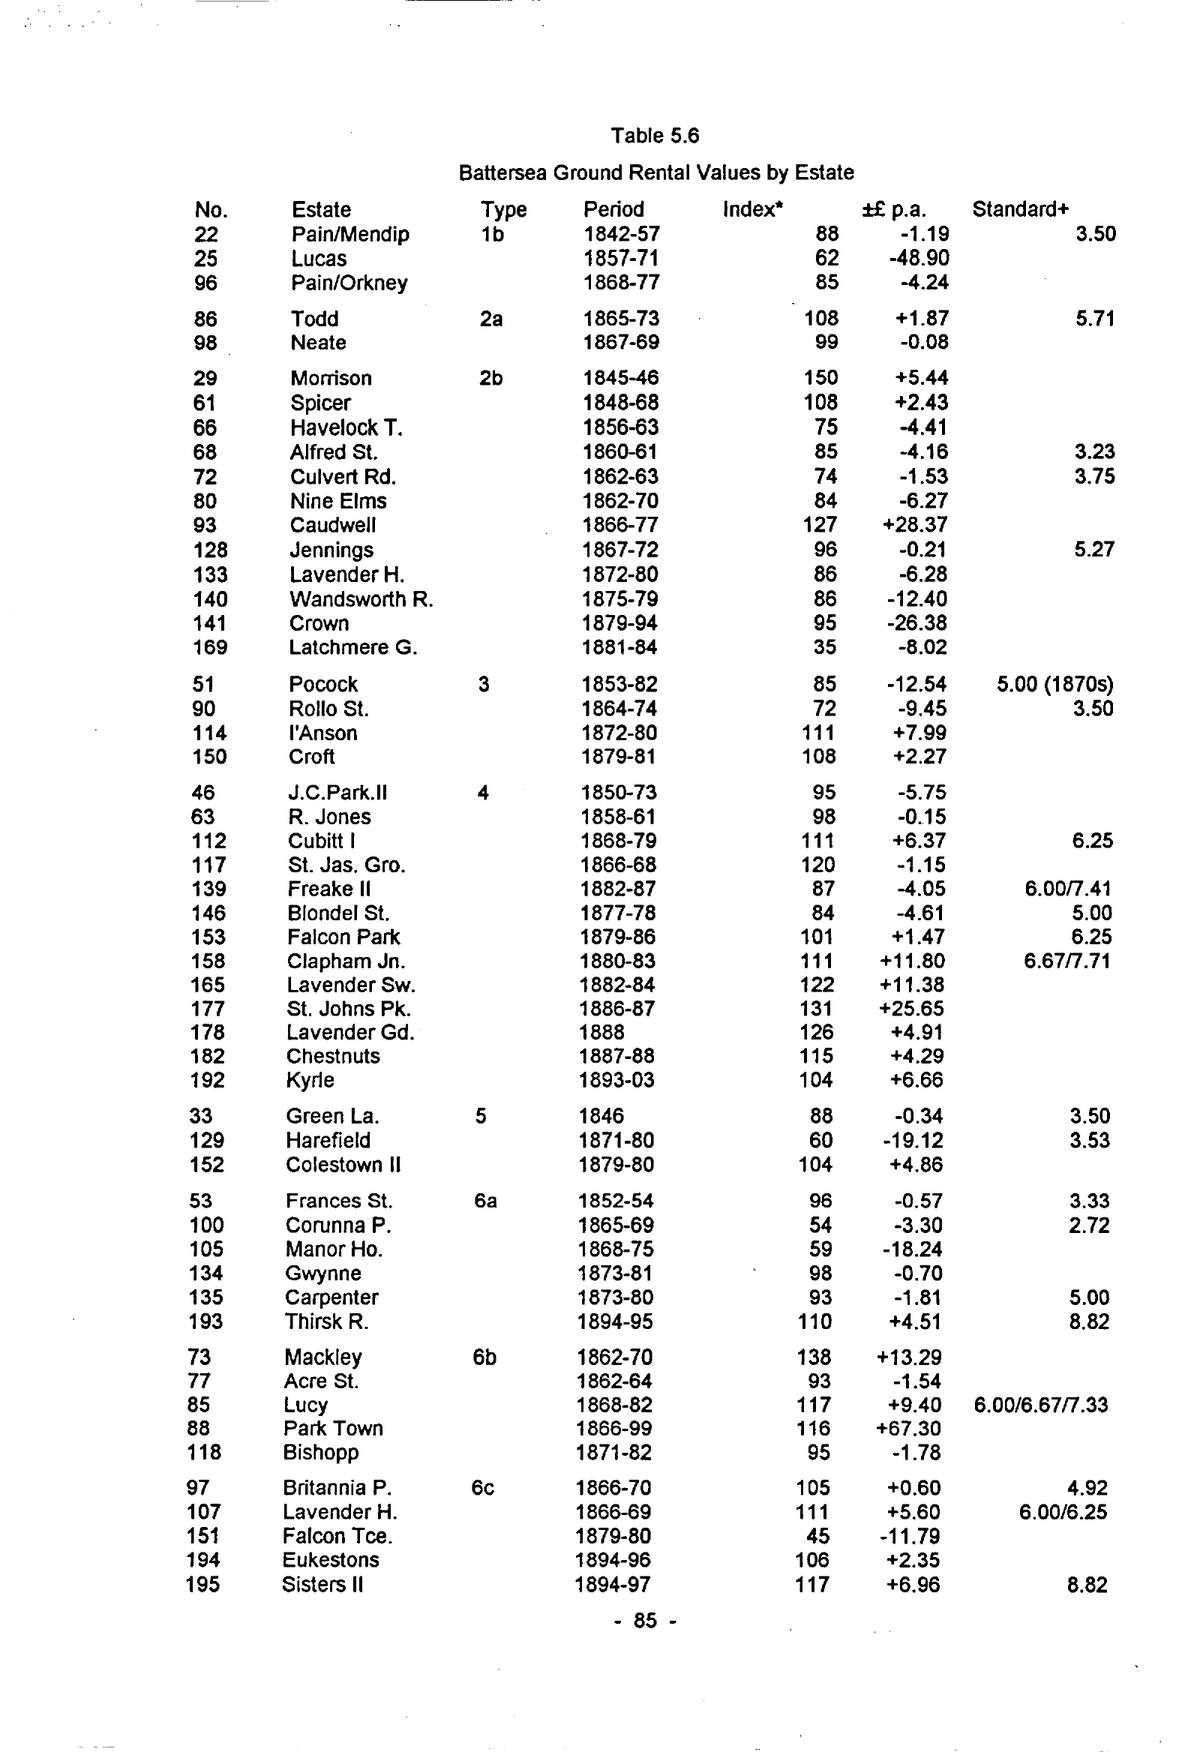
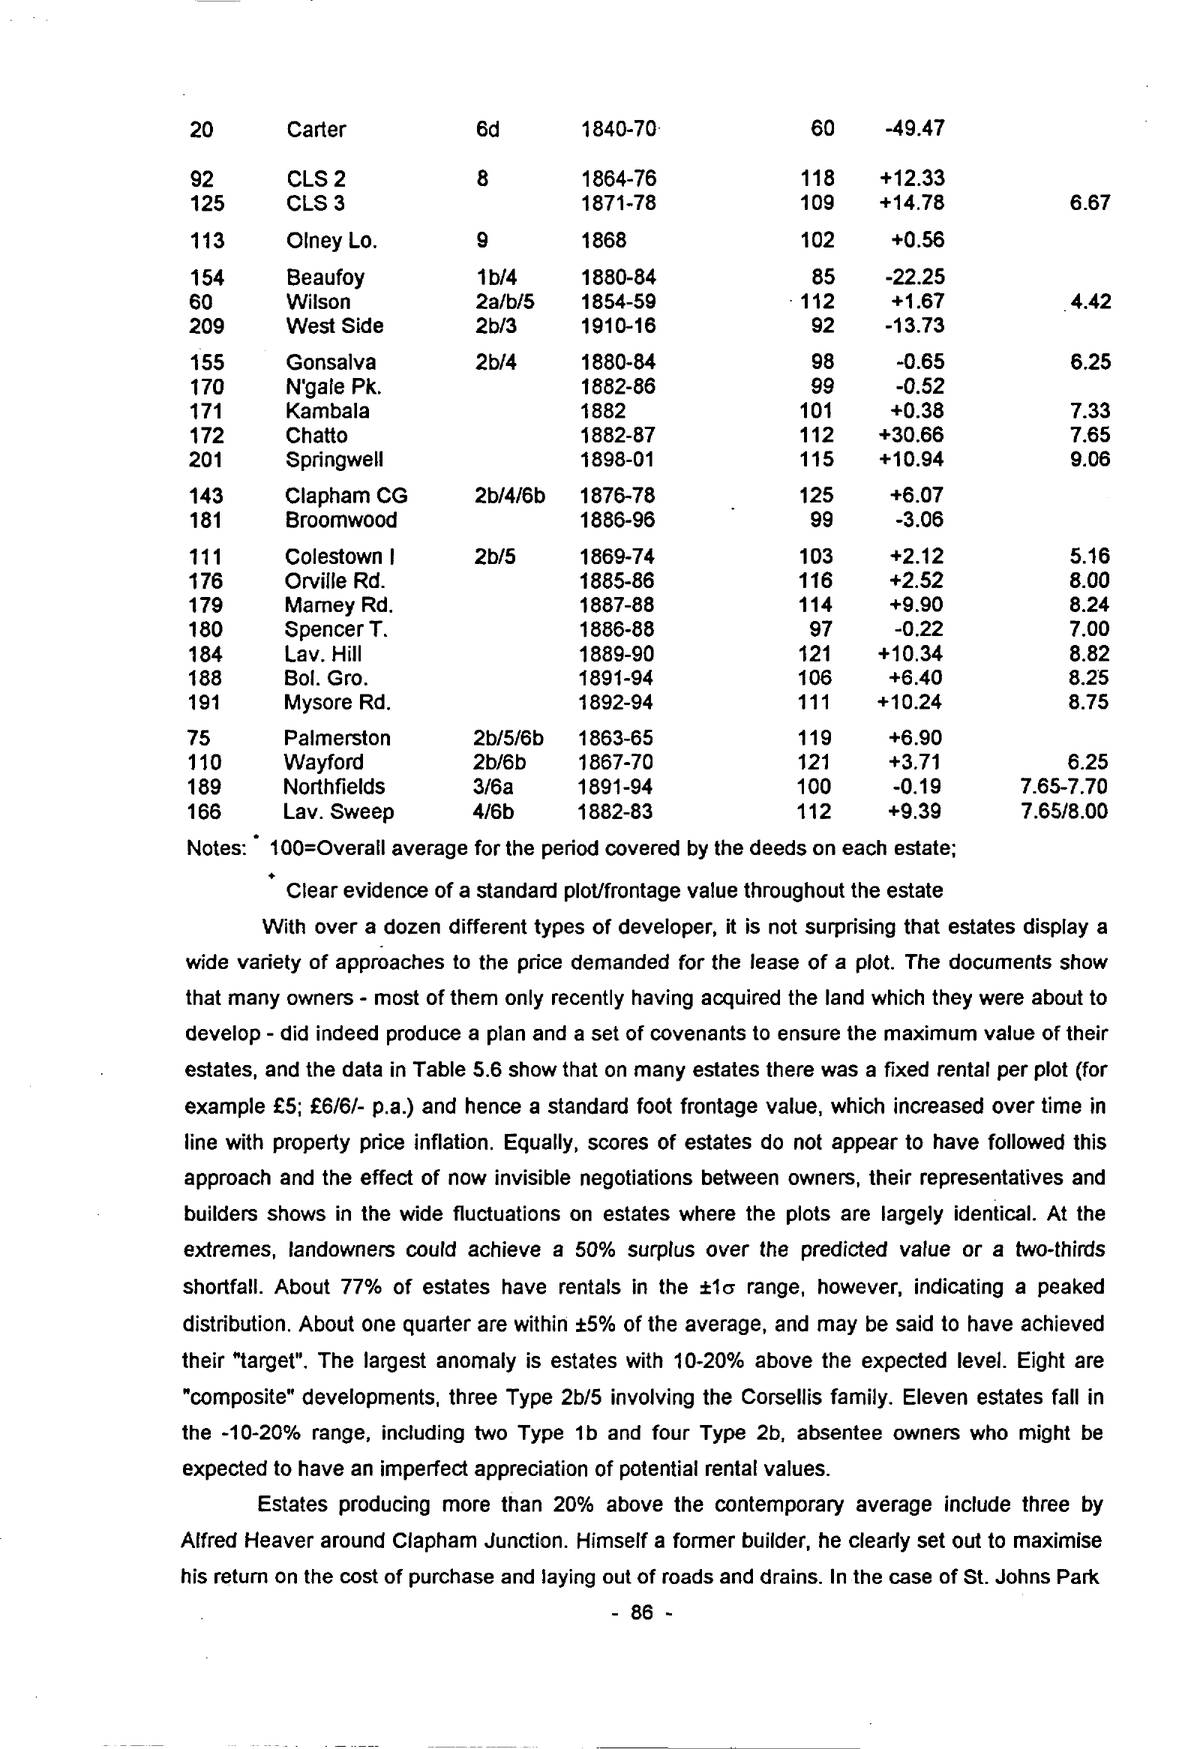
This simple picture is belied, however, by individual leases. The standard deviations in Table 5.5 (about 30-35% ± mean in most decades) show that developers were far from consistent in their approach to rents, and it is appropriate to examine in more detail some of the evidence for variations within decades and types of estate (see Table 7.10 for the classification). It might be thought that an owner developing his property would ensure that a competent architect or surveyor drew up the ground plan so as to maximise the number and value of houses, consistent with by-laws and the requirements of the District Surveyor, and that his solicitor specified the conditions of building to achieve the desired social structure. That, after all, is the way in which the great estates owned by the nobility and institutions proceeded, in theory at least. Even they did not always achieve their goals, however, being frustrated by factors such as the exigencies of the housing market, the presence of undesirable neighbours and their socially damaging developments and the fickleness of tenants who persisted in moving to newer houses with better amenities, creating a downward social spiral which even the greatest landlord found difficult to reverse.12 Since Battersea did not contain such an estate prior to suburbanisation, and the Crown Estate ([141] created 1846-53) was not developed in that way, it follows that the strategy of developers left a lot to be desired, not least because their knowledge of the market and the willingness of builders and tenants to fulfil their aspirations was often imperfect. Even the clear tendency for north Battersea to be industrial (from 1700) and criss-crossed by railways (from 1835), did not diminish the desire of many owners to provide middle-class housing. The Flowers at Park Town [88] were the classic case, where the estate was laid out in 1863 at the time of maximum disruption by railway building.13 Builders, however, often knew better and most Battersea housing at any given time was built with a reasonably accurate perception of its likely first tenants. That, reinforced by the fact that estates developed directly by builders formed one of the largest categories, provides some clue as to the progress of rental values. Data relating specific estates to the average for their period are set out below, along with estimates of the surplus/foregone rental on each estate, extrapolating the sample to the whole estate.
| No. | Estate | Type | Period | Index∗ | ±£ p.a. | Standard+ |
|---|---|---|---|---|---|---|
| 22 | Pain/Mendip | 1b | 1842-57 | 88 | -1.19 | 3.50 |
| 25 | Lucas | 1857-71 | 62 | -48.90 | ||
| 96 | Pain/Orkney | 1868-77 | 85 | -4.24 | ||
| 86 | Todd | 2a | 1865-73 | 108 | +1.87 | 5.71 |
| 98 | Neate | 1867-69 | 99 | -0.08 | ||
| 29 | Morrison | 2b | 1845-46 | 150 | +5.44 | |
| 61 | Spicer | 1848-68 | 108 | +2.43 | ||
| 66 | Havelock T. | 1856-63 | 75 | -4.41 | ||
| 68 | Alfred St. | 1860-61 | 85 | -4.16 | 3.23 | |
| 72 | Culvert Rd. | 1862-63 | 74 | -1.53 | 3.75 | |
| 80 | Nine Elms | 1862-70 | 84 | -6.27 | ||
| 93 | Caudwell | 1866-77 | 127 | +28.37 | ||
| 128 | Jennings | 1867-72 | 96 | -0.21 | 5.27 | |
| 133 | Lavender H. | 1872-80 | 86 | -6.28 | ||
| 140 | Wandsworth R. | 1875-79 | 86 | -12.40 | ||
| 141 | Crown | 1879-94 | 95 | -26.38 | ||
| 169 | Latchmere G. | 1881-84 | 35 | -8.02 | ||
| 51 | Pocock | 3 | 1853-82 | 85 | -12.54 | 5.00 (1870s) |
| 90 | Rollo St. | 1864-74 | 72 | -9.45 | 3.50 | |
| 114 | I’Anson | 1872-80 | 111 | +7.99 | ||
| 150 | Croft | 1879-81 | 108 | +2.27 | ||
| 46 | J.C.Park.II | 4 | 1850-73 | 95 | -5.75 | |
| 63 | R. Jones | 1858-61 | 98 | -0.15 | ||
| 112 | Cubitt I | 1868-79 | 111 | +6.37 | 6.25 | |
| 117 | St. Jas. Gro. | 1866-68 | 120 | -1.15 | ||
| 139 | Freake II | 1882-87 | 87 | -4.05 | 6.00/7.41 | |
| 146 | Blondel St. | 1877-78 | 84 | -4.61 | 5.00 | |
| 153 | Falcon Park | 1879-86 | 101 | +1.47 | 6.25 | |
| 158 | Clapham Jn. | 1880-83 | 111 | +11.80 | 6.67/7.71 | |
| 165 | Lavender Sw. | 1882-84 | 122 | +11.38 | ||
| 177 | St. Johns Pk. | 1886-87 | 131 | +25.65 | ||
| 178 | Lavender Gd. | 1888 | 126 | +4.91 | ||
| 182 | Chestnuts | 1887-88 | 115 | +4.29 | ||
| 192 | Kyrle | 1893-03 | 104 | +6.66 | ||
| 33 | Green La. | 5 | 1846 | 88 | -0.34 | 3.50 |
| 129 | Harefield | 1871-80 | 60 | -19.12 | 3.53 | |
| 152 | Colestown II | 1879-80 | 104 | +4.86 | ||
| 53 | Frances St. | 6a | 1852-54 | 96 | -0.57 | 3.33 |
| 100 | Corunna P. | 1865-69 | 54 | -3.30 | 2.72 | |
| 105 | Manor Ho. | 1868-75 | 59 | -18.24 | ||
| 134 | Gwynne | 1873-81 | 98 | -0.70 | ||
| 135 | Carpenter | 1873-80 | 93 | -1.81 | 5.00 | |
| 193 | Thirsk R. | 1894-95 | 110 | +4.51 | 8.82 | |
| 73 | Mackley | 6b | 1862-70 | 138 | +13.29 | |
| 77 | Acre St. | 1862-64 | 93 | -1.54 | ||
| 85 | Lucy | 1868-82 | 117 | +9.40 | 6.00/6.67/7.33 | |
| 88 | Park Town | 1866-99 | 116 | +67.30 | ||
| 118 | Bishopp | 1871-82 | 95 | -1.78 | ||
| 97 | Britannia P. | 6c | 1866-70 | 105 | +0.60 | 4.92 |
| 107 | Lavender H. | 1866-69 | 111 | +5.60 | 6.00/6.25 | |
| 151 | Falcon Tce. | 1879-80 | 45 | -11.79 | ||
| 194 | Eukestons | 1894-96 | 106 | +2.35 | ||
| 195 | Sisters II | 1894-97 | 117 | +6.96 | 8.82 |
| No. | Estate | Type | Period | Index∗ | ±£ p.a. | Standard+ |
|---|---|---|---|---|---|---|
| 20 | Carter | 6d | 1840-70 | 60 | -49.47 | |
| 92 | CLS 2 | 8 | 1864-76 | 118 | +12.33 | |
| 125 | CLS 3 | 1871-78 | 109 | +14.78 | 6.67 | |
| 113 | Olney Lo. | 9 | 1868 | 102 | +0.56 | |
| 154 | Beaufoy | 1b/4 | 1880-84 | 85 | -22.25 | |
| 60 | Wilson | 2a/b/5 | 1854-59 | 112 | +1.67 | 4.42 |
| 209 | West Side | 2b/3 | 1910-16 | 92 | -13.73 | |
| 155 | Gonsalva | 2b/4 | 1880-84 | 98 | -0.65 | 6.25 |
| 170 | N’gale Pk. | 1882-86 | 99 | -0.52 | ||
| 171 | Kambala | 1882 | 101 | +0.38 | 7.33 | |
| 172 | Chatto | 1882-87 | 112 | +30.66 | 7.65 | |
| 201 | Springwell | 1898-01 | 115 | +10.94 | 9.06 | |
| 143 | Clapham CG | 2b/4/6b | 1876-78 | 125 | +6.07 | |
| 181 | Broomwood | 1886-96 | 99 | -3.06 | ||
| 111 | Colestown I | 2b/5 | 1869-74 | 103 | +2.12 | 5.16 |
| 176 | Orville Rd. | 1885-86 | 116 | +2.52 | 8.00 | |
| 179 | Marney Rd. | 1887-88 | 114 | +9.90 | 8.24 | |
| 180 | Spencer T. | 1886-88 | 97 | -0.22 | 7.00 | |
| 184 | Lav. Hill | 1889-90 | 121 | +10.34 | 8.82 | |
| 188 | Bol. Gro. | 1891-94 | 106 | +6.40 | 8.25 | |
| 191 | Mysore Rd. | 1892-94 | 111 | +10.24 | 8.75 | |
| 75 | Palmerston | 2b/5/6b | 1863-65 | 119 | +6.90 | |
| 110 | Wayford | 2b/6b | 1867-70 | 121 | +3.71 | 6.25 |
| 189 | Northfields | 3/6a | 1891-94 | 100 | -0.19 | 7.65-7.70 |
| 166 | Lav. Sweep | 4/6b | 1882-83 | 112 | +9.39 | 7.65/8.00 |
Notes: ∗ 100=Overall average for the period covered by the deeds on each estate;
+ Clear evidence of a standard plot/frontage value throughout the estate
With over a dozen different types of developer, it is not surprising that estates display a wide variety of approaches to the price demanded for the lease of a plot. The documents show that many owners – most of them only recently having acquired the land which they were about to develop – did indeed produce a plan and a set of covenants to ensure the maximum value of their estates, and the data in Table 5.6 show that on many estates there was a fixed rental per plot (for example £5; £6/6/- p.a.) and hence a standard foot frontage value, which increased over time in line with property price inflation. Equally, scores of estates do not appear to have followed this approach and the effect of now invisible negotiations between owners, their representatives and builders shows in the wide fluctuations on estates where the plots are largely identical. At the extremes, landowners could achieve a 50% surplus over the predicted value or a two-thirds shortfall. About 77% of estates have rentals in the ±1σ range, however, indicating a peaked distribution. About one quarter are within ±5% of the average, and may be said to have achieved their “target”. The largest anomaly is estates with 10-20% above the expected level. Eight are “composite” developments, three Type 2b/5 involving the Corsellis family. Eleven estates fall in the -10-20% range, including two Type 1b and four Type 2b, absentee owners who might be expected to have an imperfect appreciation of potential rental values.
Estates producing more than 20% above the contemporary average include three by Alfred Heaver around Clapham Junction. Himself a former builder, he clearly set out to maximise his return on the cost of purchase and laying out of roads and drains. In the case of St. Johns Park
p. 87[177] and Chestnuts [182], the proximity of the new commercial centre enabled him to charge a premium for ordinary house plots, which led in some streets to the erection of three-storey houses. Lavender Gardens [178] was a high-status scheme, with link-detached houses having frontages up to forty feet. Ingram, Brown and Bragg’s Clapham Common Gardens [143], with rentals 25% above average also had substantial three-storey houses. High rentals did not always mean high status development, however. Park Town (88; +16%), Wayford Street (110; +21%) and Orville Road (176; +16%) all pitched high and ended up crowded with artisans and, in the latter, Booth’s Classes A-C. Indeed, Booth used Orville Road as a specific example of jerry-building leading to rapid social and structural decay. By implication, high rents charged by builders and subsequent owners to recoup their commitments to the landowner encouraged a shifting population.14
The following types have higher-than-expected ground rents: 2a; 4; 6b; 6c; 8; 9; 2b/4; 2b/5. In the case of the land companies, of course, this profit went to those who purchased the freehold plots prior to building. Types which made less than expected were: 1b; 2b; 3; 5; 6a; 6d. There were wide variations within Types. Original owners and early developers with a background in market gardening, such as John Lucas [25] and the Carters [20] settled for much less than they could have obtained – about £50/year in each case, thousands of pounds over the life of a lease. Previous experience of agricultural values, where £10/acre/year was a high rent, no doubt had some influence, since that could be obtained from a handful of houses. Furthermore, such developers seldom changed their policy during the protracted process of completing their schemes. Lucas was still charging Henry Menhinnick less than 3/6 per foot on houses in the late-1860s, probably reflecting his anxiety to complete a scheme started in the late-1840s, and also the builder’s ability to strike a favourable bargain in exchange for erecting several complete streets. As elsewhere, awkwardly-shaped plots attracted a very low rent – e.g. 14-18 Tidbury Street, leased for about 1/1 per foot, with barely room for a house on the tapering plots.
More surprising were men like the architect/surveyor Charles Lee, who settled for only 72% of the going rate on his Rollo Street estate [90] in the 1860s boom, although this was not out of line with contemporary developments south of Battersea Park Road, where cheap leases filled a score of estates with two-storey brick boxes. Solicitor Evan Hare used the technique of selling plots on his railway-bound estate [129], usually for £45 (about £1,925/acre). The severe depression after 1870 caused the new owners to reduce their aspirations, hence the low ground rents, foregoing an average of 2/4 per foot. Unlike many cul-de-sac estates, Harefield retained its artisan status. James Bennett of Downton, Wilts., who completed Latchmere Grove [169] was also confronted with a blind end surrounded by railways and some awkward plot shapes, forcing him to settle for less than 3/- per foot. Bennett, then a Balham draper, had been involved at nearby Wayford Street in the late-1860s. In that case he and his partner were able to get 6/3 per foot. Benjamin Edgington, a Southwark marquee maker, also made far less than he could have done on his two estates – Corunna Place [100] and Manor House [105] – netting £22 p.a. less than the average for the period. This may be explained in the first case by the close proximity of industry and yet more railways, and in the second by the estate being cut in two by the WLER embankment.
Most estates developed after 1880 in central and south Battersea had high ground rents,
p. 88which did produce middle-class housing, for example: Eukestons and Sisters Avenue II [194; 195], both owned by Members of Parliament, and the Corsellis estates of Marney Road, Lavender Hill, Bolingbroke Grove and Mysore Road [179; 184; 188; 191].
William Howey’s market garden just north of Clapham Junction provides a good illustration of the trend in ground rents. It was bought by Job Caudwell [93], for whom George Todd drew up plans for 350 plots, almost all with 16ft. frontages and appropriate reservation of corner sites for shops, etc.15 Caudwell operated a high rental policy, for he appears to have seen it as the home of lower middle-class railway users. In fact, it was filled with railway employees and workers in local industry, belonging to Booth’s Class D. The average rental obtained was 6.97/- per foot, which forced builders to maximise the use of the land. Booth confirms this in his account of Speke Road,16 where most houses had three storeys, some with semi-basements, many ‘out of repair, ... all wretchedly built’. In 1867, their estimated gross rentals were mostly in the £25-30 range (9/6-11/6 per week), confirming their larger-than-average size (rentals for small two-storey houses were in the £8-15 range) and pre-ordained tendency to overcrowding and social decline.17 None of this of course would have concerned the ground landlord at such an early stage in the 99-year lease period. Caudwell made 1.86 sh/ft. a year more than the 1860s average for Battersea, which represents an increment of £574 p.a. for the whole estate (£2,143 cf. £1,569 p.a.), a substantial income in its own right.
As always, however, averages conceal variation, and Caudwell profited from builders prepared to pay over the odds for plots. George Reeve of Camberwell took at least eleven plots in Grant Road in February 1866 for £6/6/- p.a. (7.875 sh./ft.), 15% higher than his peers in the same street such as Frederick Rimell. In March, 1867, Reeve paid only £5 p.a. for four plots in Grant Road. His initial miscalculation doubtless contributed to his bankruptcy in January 1870.18 The glut of houses in the area probably meant that he was unable to let houses at rents sufficient to pay the inflated ground rents and building costs. Henry Shillito took at least sixteen plots in Speke Road in 1868 at £5 p.a., virtually identical with the Battersea average for the 1860s. It is clear that Caudwell (and/or Todd) were unable to make high rents “stick” if a builder was prepared to negotiate a lower figure for a substantial block. Such trading evidently went on continuously, but the details are denied to us in the absence of any written record – if such was ever made.
This variability of ground rents within and between estates was not unique to Battersea. Somers Town in St. Pancras also started out with high expectations, influenced in part by its southern neighbour the Bedford Estate.19 In the fifty years from 1786 which it took to complete, the bargaining ability of each side changed frequently, as did ground rents, at a time when the nature of the building industry itself was undergoing significant change. The social class of the end-product did not match the aspirations of those who initiated the development.20 Treen indicates a wide range of plot prices on the Brown Estate in north Leeds (1883-1904), not necessarily related to date or position.21
The outcome of a high ground rents: overcrowded houses tending to slums, or successful middle-class development, was not necessarily a foregone conclusion. Henry Corsellis achieved both: the former at Orville Road (1884) and the latter in central and south Battersea (1886-96). This may be explained by the involvement of John and Walter Stanbury, builder and architect, in
p. 89most of the latter, again showing that those most directly involved in the building process could exercise the degree of control needed to achieve the prize of respectability. In other words, to replicate the success of the great landed estates at local level.
V: House Prices
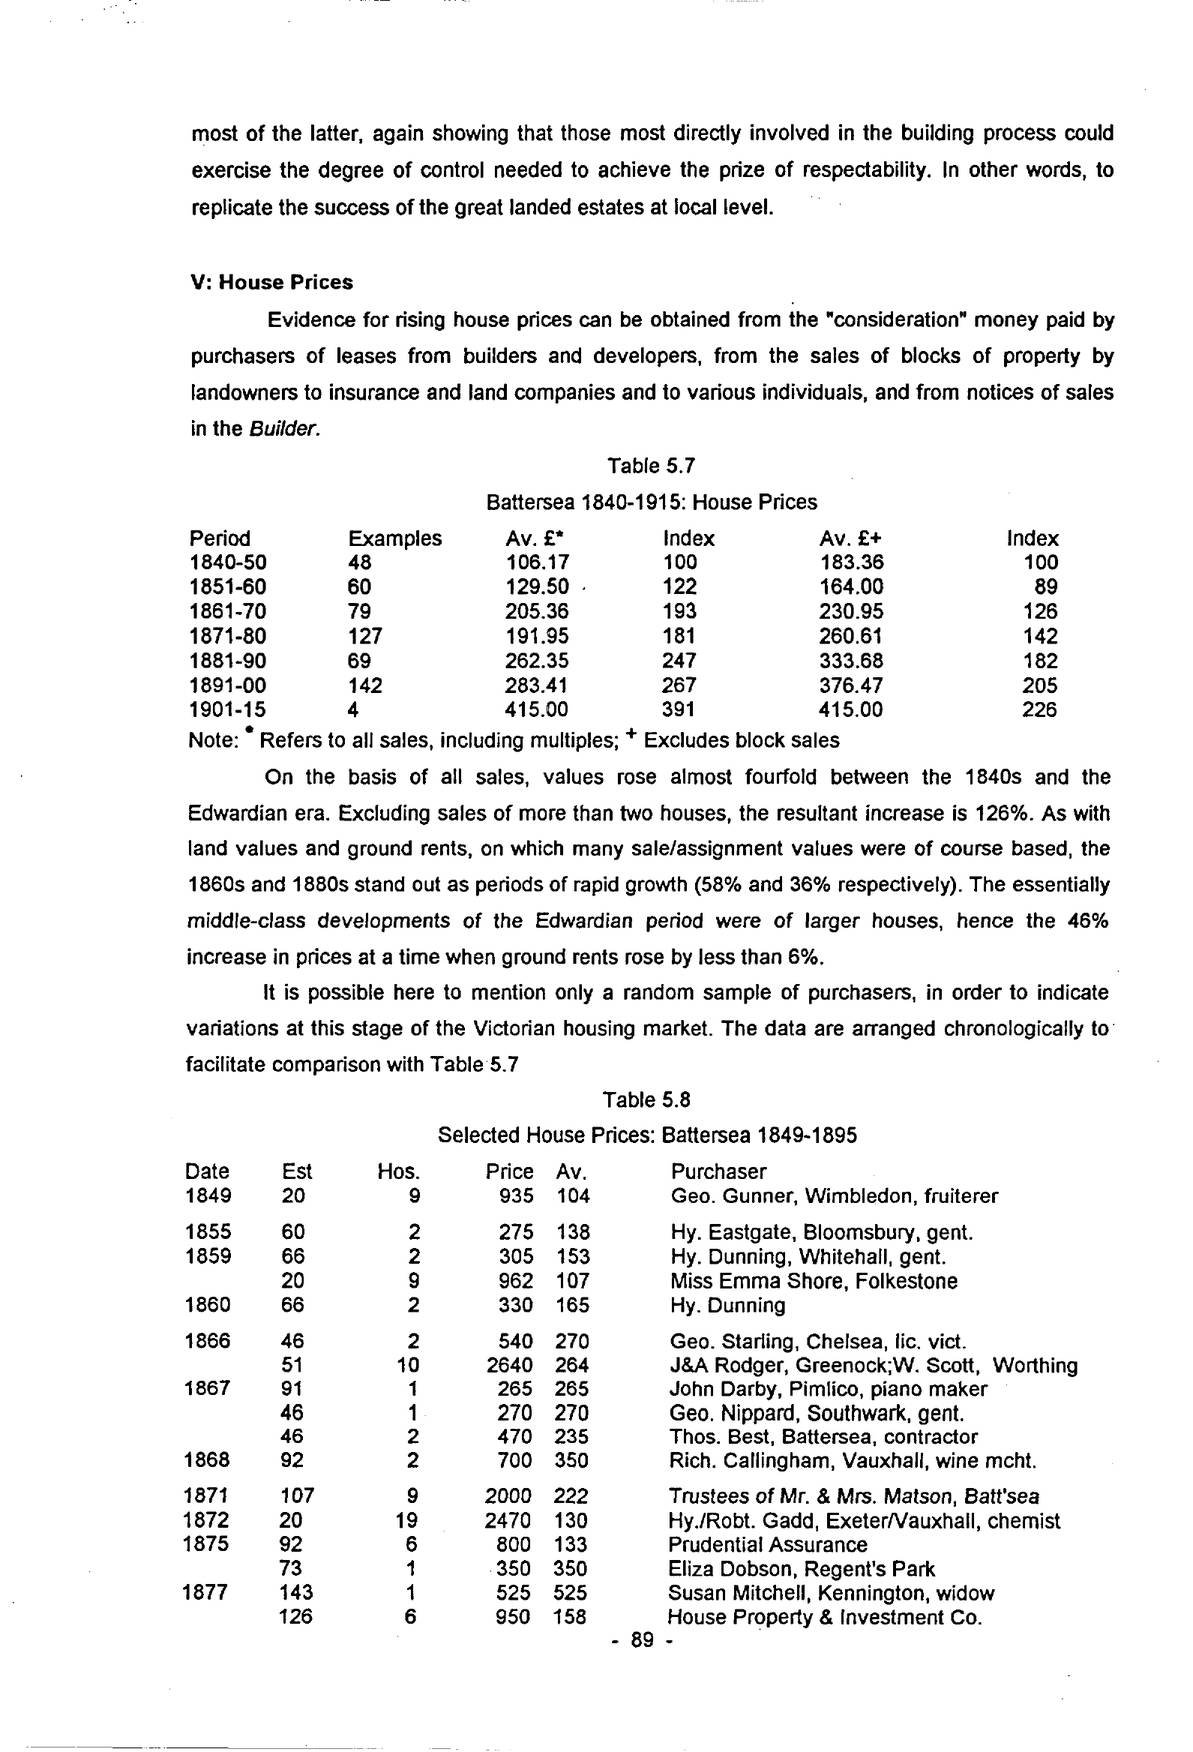
Evidence for rising house prices can be obtained from the “consideration” money paid by purchasers of leases from builders and developers, from the sales of blocks of property by landowners to insurance and land companies and to various individuals, and from notices of sales in the Builder.
| Period | Examples | Av. £∗ | Index | Av. £+ | Index |
|---|---|---|---|---|---|
| 1840-50 | 48 | 106.17 | 100 | 183.36 | 100 |
| 1851-60 | 60 | 129.50 | 122 | 164.00 | 89 |
| 1861-70 | 79 | 205.36 | 193 | 230.95 | 126 |
| 1871-80 | 127 | 191.95 | 181 | 260.61 | 142 |
| 1881-90 | 69 | 262.35 | 247 | 333.68 | 182 |
| 1891-00 | 142 | 283.41 | 267 | 376.47 | 205 |
| 1901-15 | 4 | 415.00 | 391 | 415.00 | 226 |
Note: ∗ Refers to all sales, including multiples; + Excludes block sales
On the basis of all sales, values rose almost fourfold between the 1840s and the Edwardian era. Excluding sales of more than two houses, the resultant increase is 126%. As with land values and ground rents, on which many sale/assignment values were of course based, the 1860s and 1880s stand out as periods of rapid growth (58% and 36% respectively). The essentially middle-class developments of the Edwardian period were of larger houses, hence the 46% increase in prices at a time when ground rents rose by less than 6%.
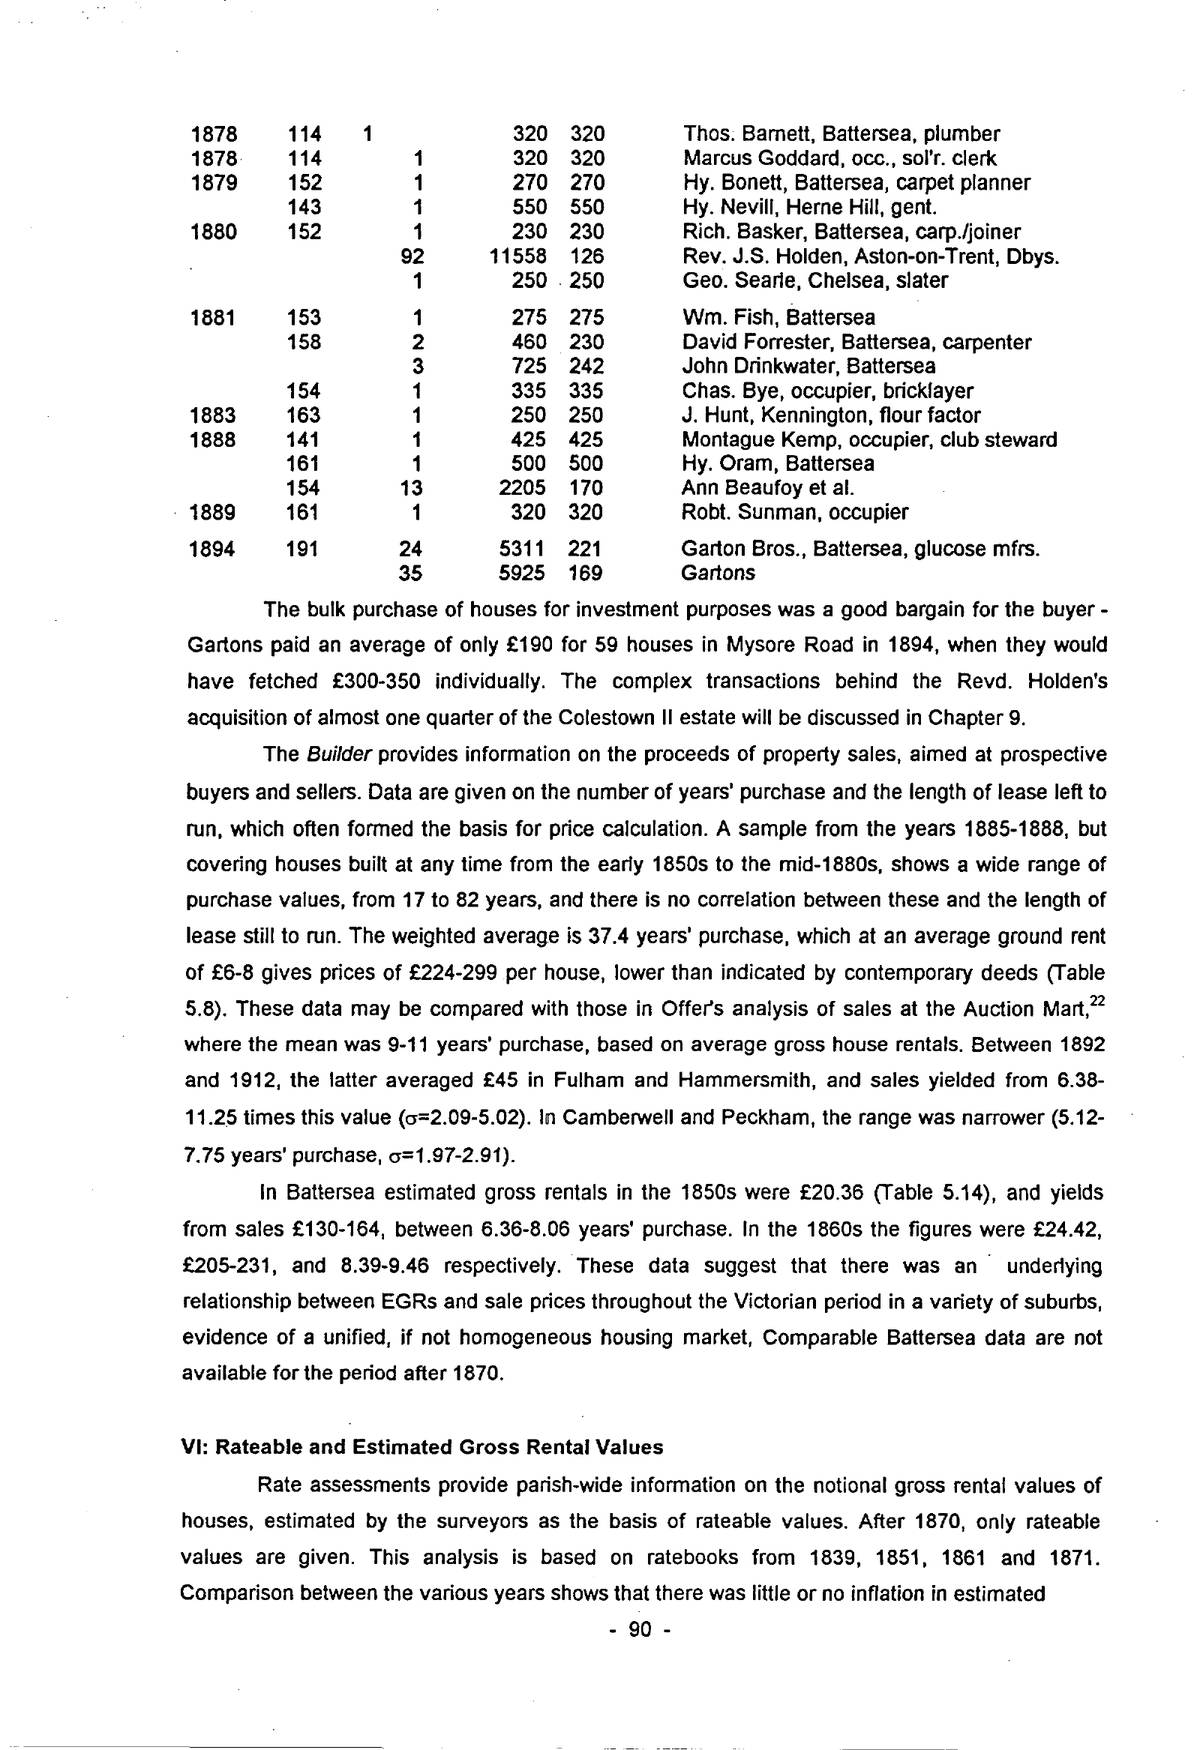
It is possible here to mention only a random sample of purchasers, in order to indicate variations at this stage of the Victorian housing market. The data are arranged chronologically to facilitate comparison with Table 5.7
| Date | Est | Hos. | Price | Av. | Purchaser |
|---|---|---|---|---|---|
| 1849 | 20 | 9 | 935 | 104 | Geo. Gunner, Wimbledon, fruiterer |
| 1855 | 60 | 2 | 275 | 138 | Hy. Eastgate, Bloomsbury, gent. |
| 1859 | 66 | 2 | 305 | 153 | Hy. Dunning, Whitehall, gent. |
| 20 | 9 | 962 | 107 | Miss Emma Shore, Folkestone | |
| 1860 | 66 | 2 | 330 | 165 | Hy. Dunning |
| 1866 | 46 | 2 | 540 | 270 | Geo. Starling, Chelsea, lic. vict. |
| 51 | 10 | 2640 | 264 | J&A Rodger, Greenock;W. Scott, Worthing | |
| 1867 | 91 | 1 | 265 | 265 | John Darby, Pimlico, piano maker |
| 46 | 1 | 270 | 270 | Geo. Nippard, Southwark, gent. | |
| 46 | 2 | 470 | 235 | Thos. Best, Battersea, contractor | |
| 1868 | 92 | 2 | 700 | 350 | Rich. Callingham, Vauxhall, wine mcht. |
| 1871 | 107 | 9 | 2000 | 222 | Trustees of Mr. & Mrs. Matson, Batt’sea |
| 1872 | 20 | 19 | 2470 | 130 | Hy./Robt. Gadd, Exeter/Vauxhall, chemist |
| 1875 | 92 | 6 | 800 | 133 | Prudential Assurance |
| 73 | 1 | 350 | 350 | Eliza Dobson, Regent’s Park | |
| 1877 | 143 | 1 | 525 | 525 | Susan Mitchell, Kennington, widow |
| 126 | 6 | 950 | 158 | House Property & Investment Co. |
| Date | Est | Hos. | Price | Av. | Purchaser |
|---|---|---|---|---|---|
| 1878 | 114 | 1 | 320 | 320 | Thos. Barnett, Battersea, plumber |
| 1878 | 114 | 1 | 320 | 320 | Marcus Goddard, occ., sol’r. clerk |
| 1879 | 152 | 1 | 270 | 270 | Hy. Bonett, Battersea, carpet planner |
| 143 | 1 | 550 | 550 | Hy. Nevill, Herne Hill, gent. | |
| 1880 | 152 | 1 | 230 | 230 | Rich. Basker, Battersea, carp./joiner |
| 92 | 11558 | 126 | Rev. J.S. Holden, Aston-on-Trent, Dbys. | ||
| 1 | 250 | 250 | Geo. Searle, Chelsea, slater | ||
| 1881 | 153 | 1 | 275 | 275 | Wm. Fish, Battersea |
| 158 | 2 | 460 | 230 | David Forrester, Battersea, carpenter | |
| 3 | 725 | 242 | John Drinkwater, Battersea | ||
| 154 | 1 | 335 | 335 | Chas. Bye, occupier, bricklayer | |
| 1883 | 163 | 1 | 250 | 250 | J. Hunt, Kennington, flour factor |
| 1888 | 141 | 1 | 425 | 425 | Montague Kemp, occupier, club steward |
| 161 | 1 | 500 | 500 | Hy. Oram, Battersea | |
| 154 | 13 | 2205 | 170 | Ann Beaufoy et al. | |
| 1889 | 161 | 1 | 320 | 320 | Robt. Sunman, occupier |
| 1894 | 191 | 24 | 5311 | 221 | Garton Bros., Battersea, glucose mfrs. |
| 35 | 5925 | 169 | Gartons |
The bulk purchase of houses for investment purposes was a good bargain for the buyer – Gartons paid an average of only £190 for 59 houses in Mysore Road in 1894, when they would have fetched £300-350 individually. The complex transactions behind the Revd. Holden’s acquisition of almost one quarter of the Colestown II estate will be discussed in Chapter 9.
The Builder provides information on the proceeds of property sales, aimed at prospective buyers and sellers. Data are given on the number of years’ purchase and the length of lease left to run, which often formed the basis for price calculation. A sample from the years 1885-1888, but covering houses built at any time from the early 1850s to the mid-1880s, shows a wide range of purchase values, from 17 to 82 years, and there is no correlation between these and the length of lease still to run. The weighted average is 37.4 years’ purchase, which at an average ground rent of £6-8 gives prices of £224-299 per house, lower than indicated by contemporary deeds (Table 5.8). These data may be compared with those in Offer’s analysis of sales at the Auction Mart,22 where the mean was 9-11 years’ purchase, based on average gross house rentals. Between 1892 and 1912, the latter averaged £45 in Fulham and Hammersmith, and sales yielded from 6.38-11.25 times this value (σ=2.09-5.02). In Camberwell and Peckham, the range was narrower (5.12-7.75 years’ purchase, σ=1.97-2.91).
In Battersea estimated gross rentals in the 1850s were £20.36 (Table 5.14), and yields from sales £130-164, between 6.36-8.06 years’ purchase. In the 1860s the figures were £24.42, £205-231, and 8.39-9.46 respectively. These data suggest that there was an underlying relationship between EGRs and sale prices throughout the Victorian period in a variety of suburbs, evidence of a unified, if not homogeneous housing market, Comparable Battersea data are not available for the period after 1870.
VI: Rateable and Estimated Gross Rental Values
Rate assessments provide parish-wide information on the notional gross rental values of houses, estimated by the surveyors as the basis of rateable values. After 1870, only rateable values are given. This analysis is based on ratebooks from 1839, 1851, 1861 and 1871. Comparison between the various years shows that there was little or no inflation in estimated
p. 91rental values in this period, the great majority remaining unchanged once set, although there was underlying growth reflecting the increasing size and value of new houses.
The March 1766 assessment provides a datum before the first upsurge in building for more than a century.
| District | Houses | Assessment |
|---|---|---|
| % | % | |
| Village | 50.42 | 31.68 |
| York Place | 15.49 | 15.49 |
| The Rise | 19.15 | 26.65 |
| Nine Elms | 14.93 | 26.19 |
The Village was still the dominant settlement, although recent growth around the Commons and at Nine Elms already accounted for 34% of houses. The Village contained large numbers of small houses, many inhabited by the poor. There is nothing in 1766 to suggest that Battersea was other than a rather sleepy backwater dependant on farming and market gardening, albeit firmly within the metropolitan sphere of influence and with an industrial base.
The pattern in 1839 was not dramatically different (see Table 2.6). There were 1,006 houses with a total EGR of £34,926. The Village had 271 of the 663 houses built since 1766 (41%). York Place had increased by 45%, but was still mainly market gardens, with industry along the Thames. The Rise/Commons/Lavender Hill area (the last virtually uninhabited in 1766) had three times as many houses, many substantial mansions with grounds, and EGRs of £200 or more. The Common Field and adjacent enclosures remained emptying 1839. To the east, Battersea New Town had added 172 houses where none existed, but Nine Elms had only 17 more (32%).
The Village and New Town were low value areas, with EGRs of £20 and £15 (7/8 and 5/9 per week). Most houses in New Town were very small, four-roomed properties with 12-15ft. frontages. In contrast south Battersea had 42% of the rental value but only 16% of the houses. Even here, however, small cottage properties were to be found, for example two estates on former waste ground on the north side of the Rise [11; 16].
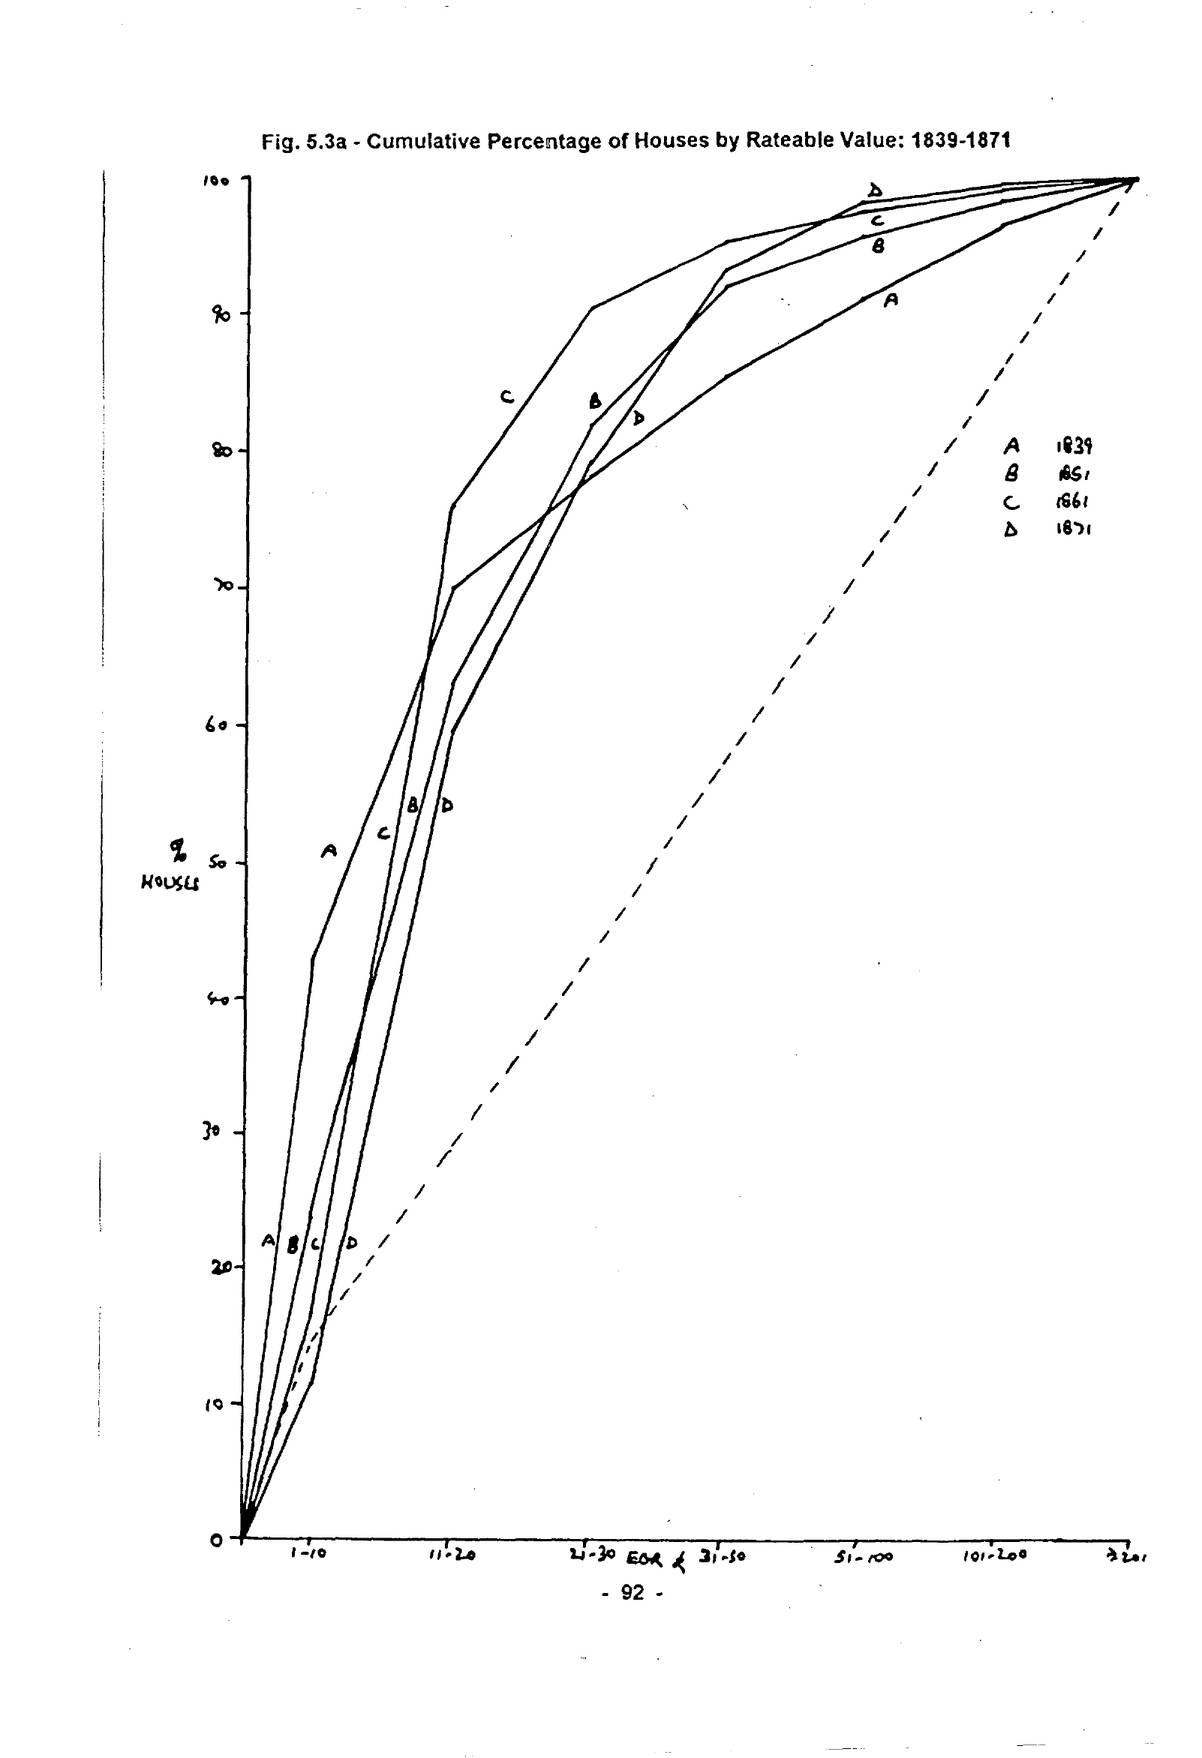
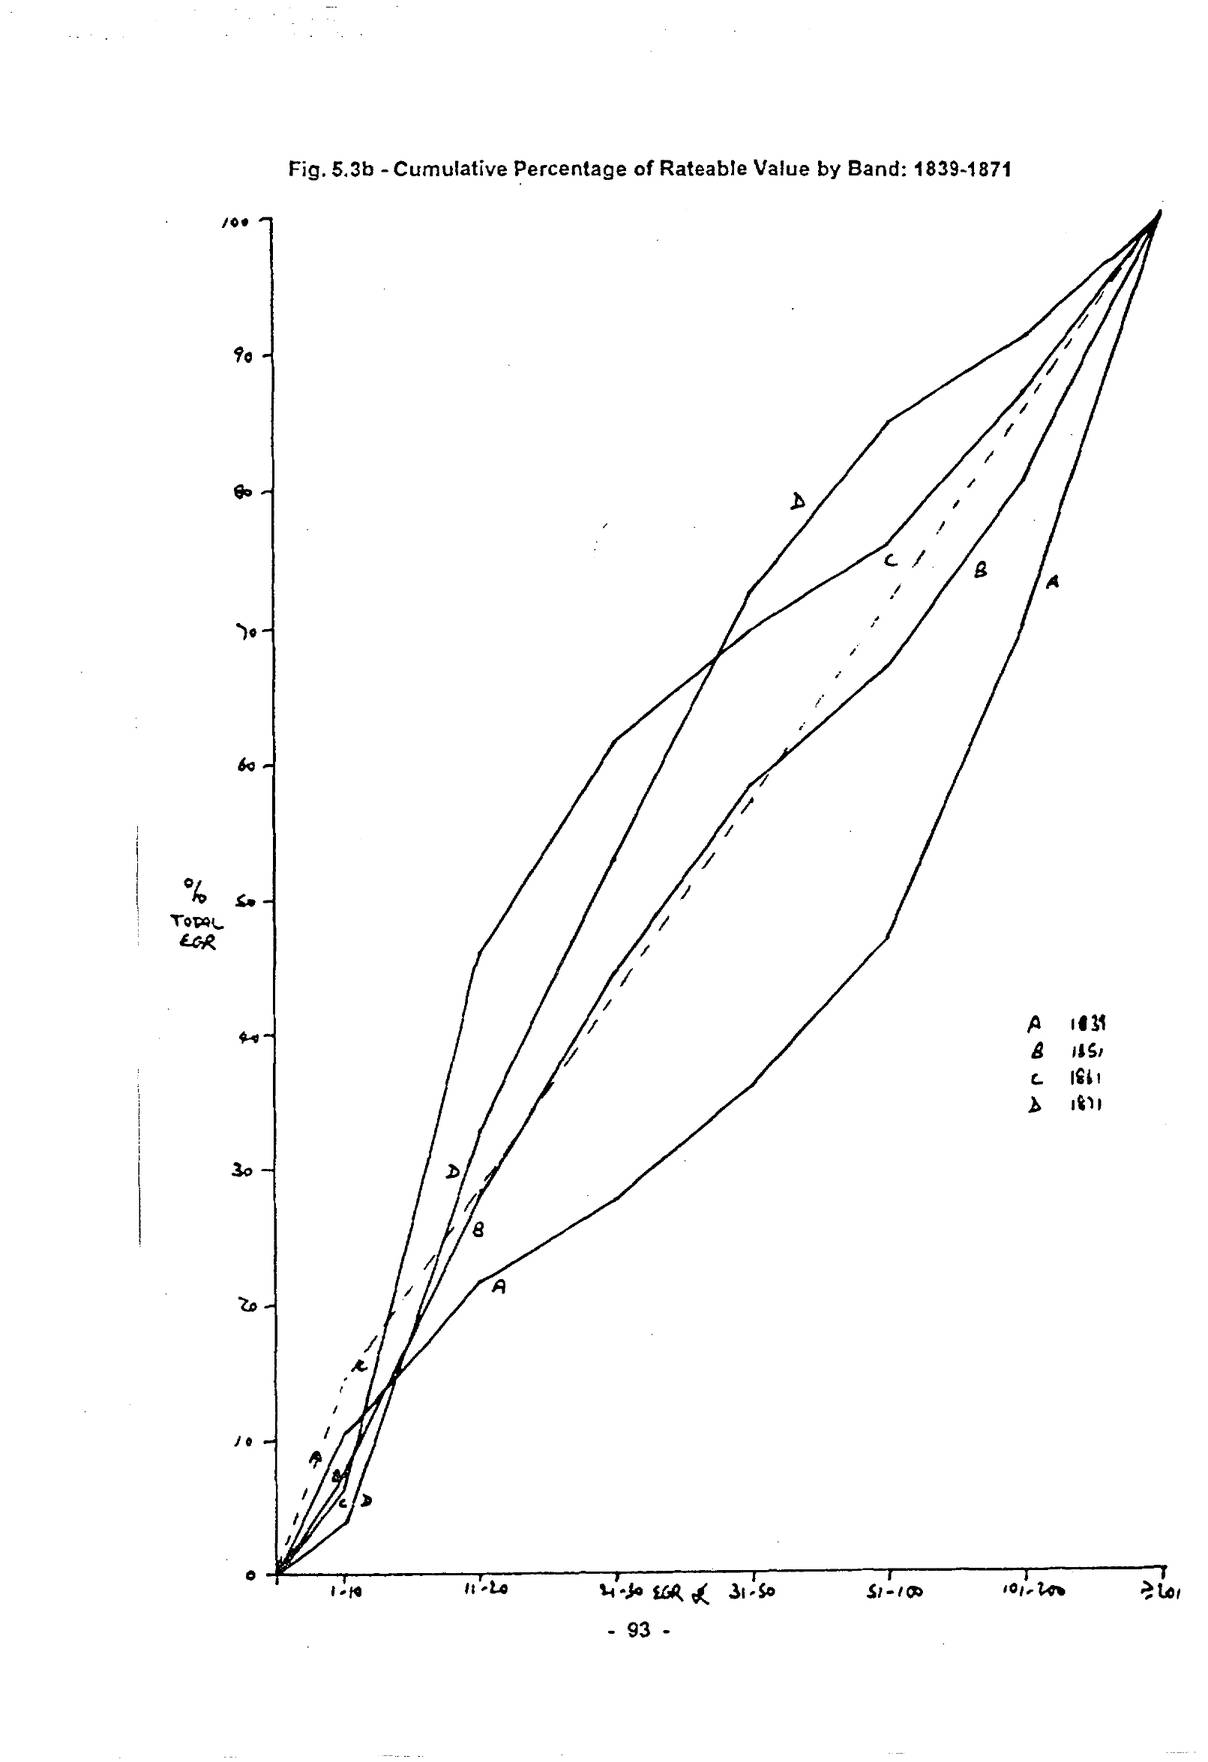
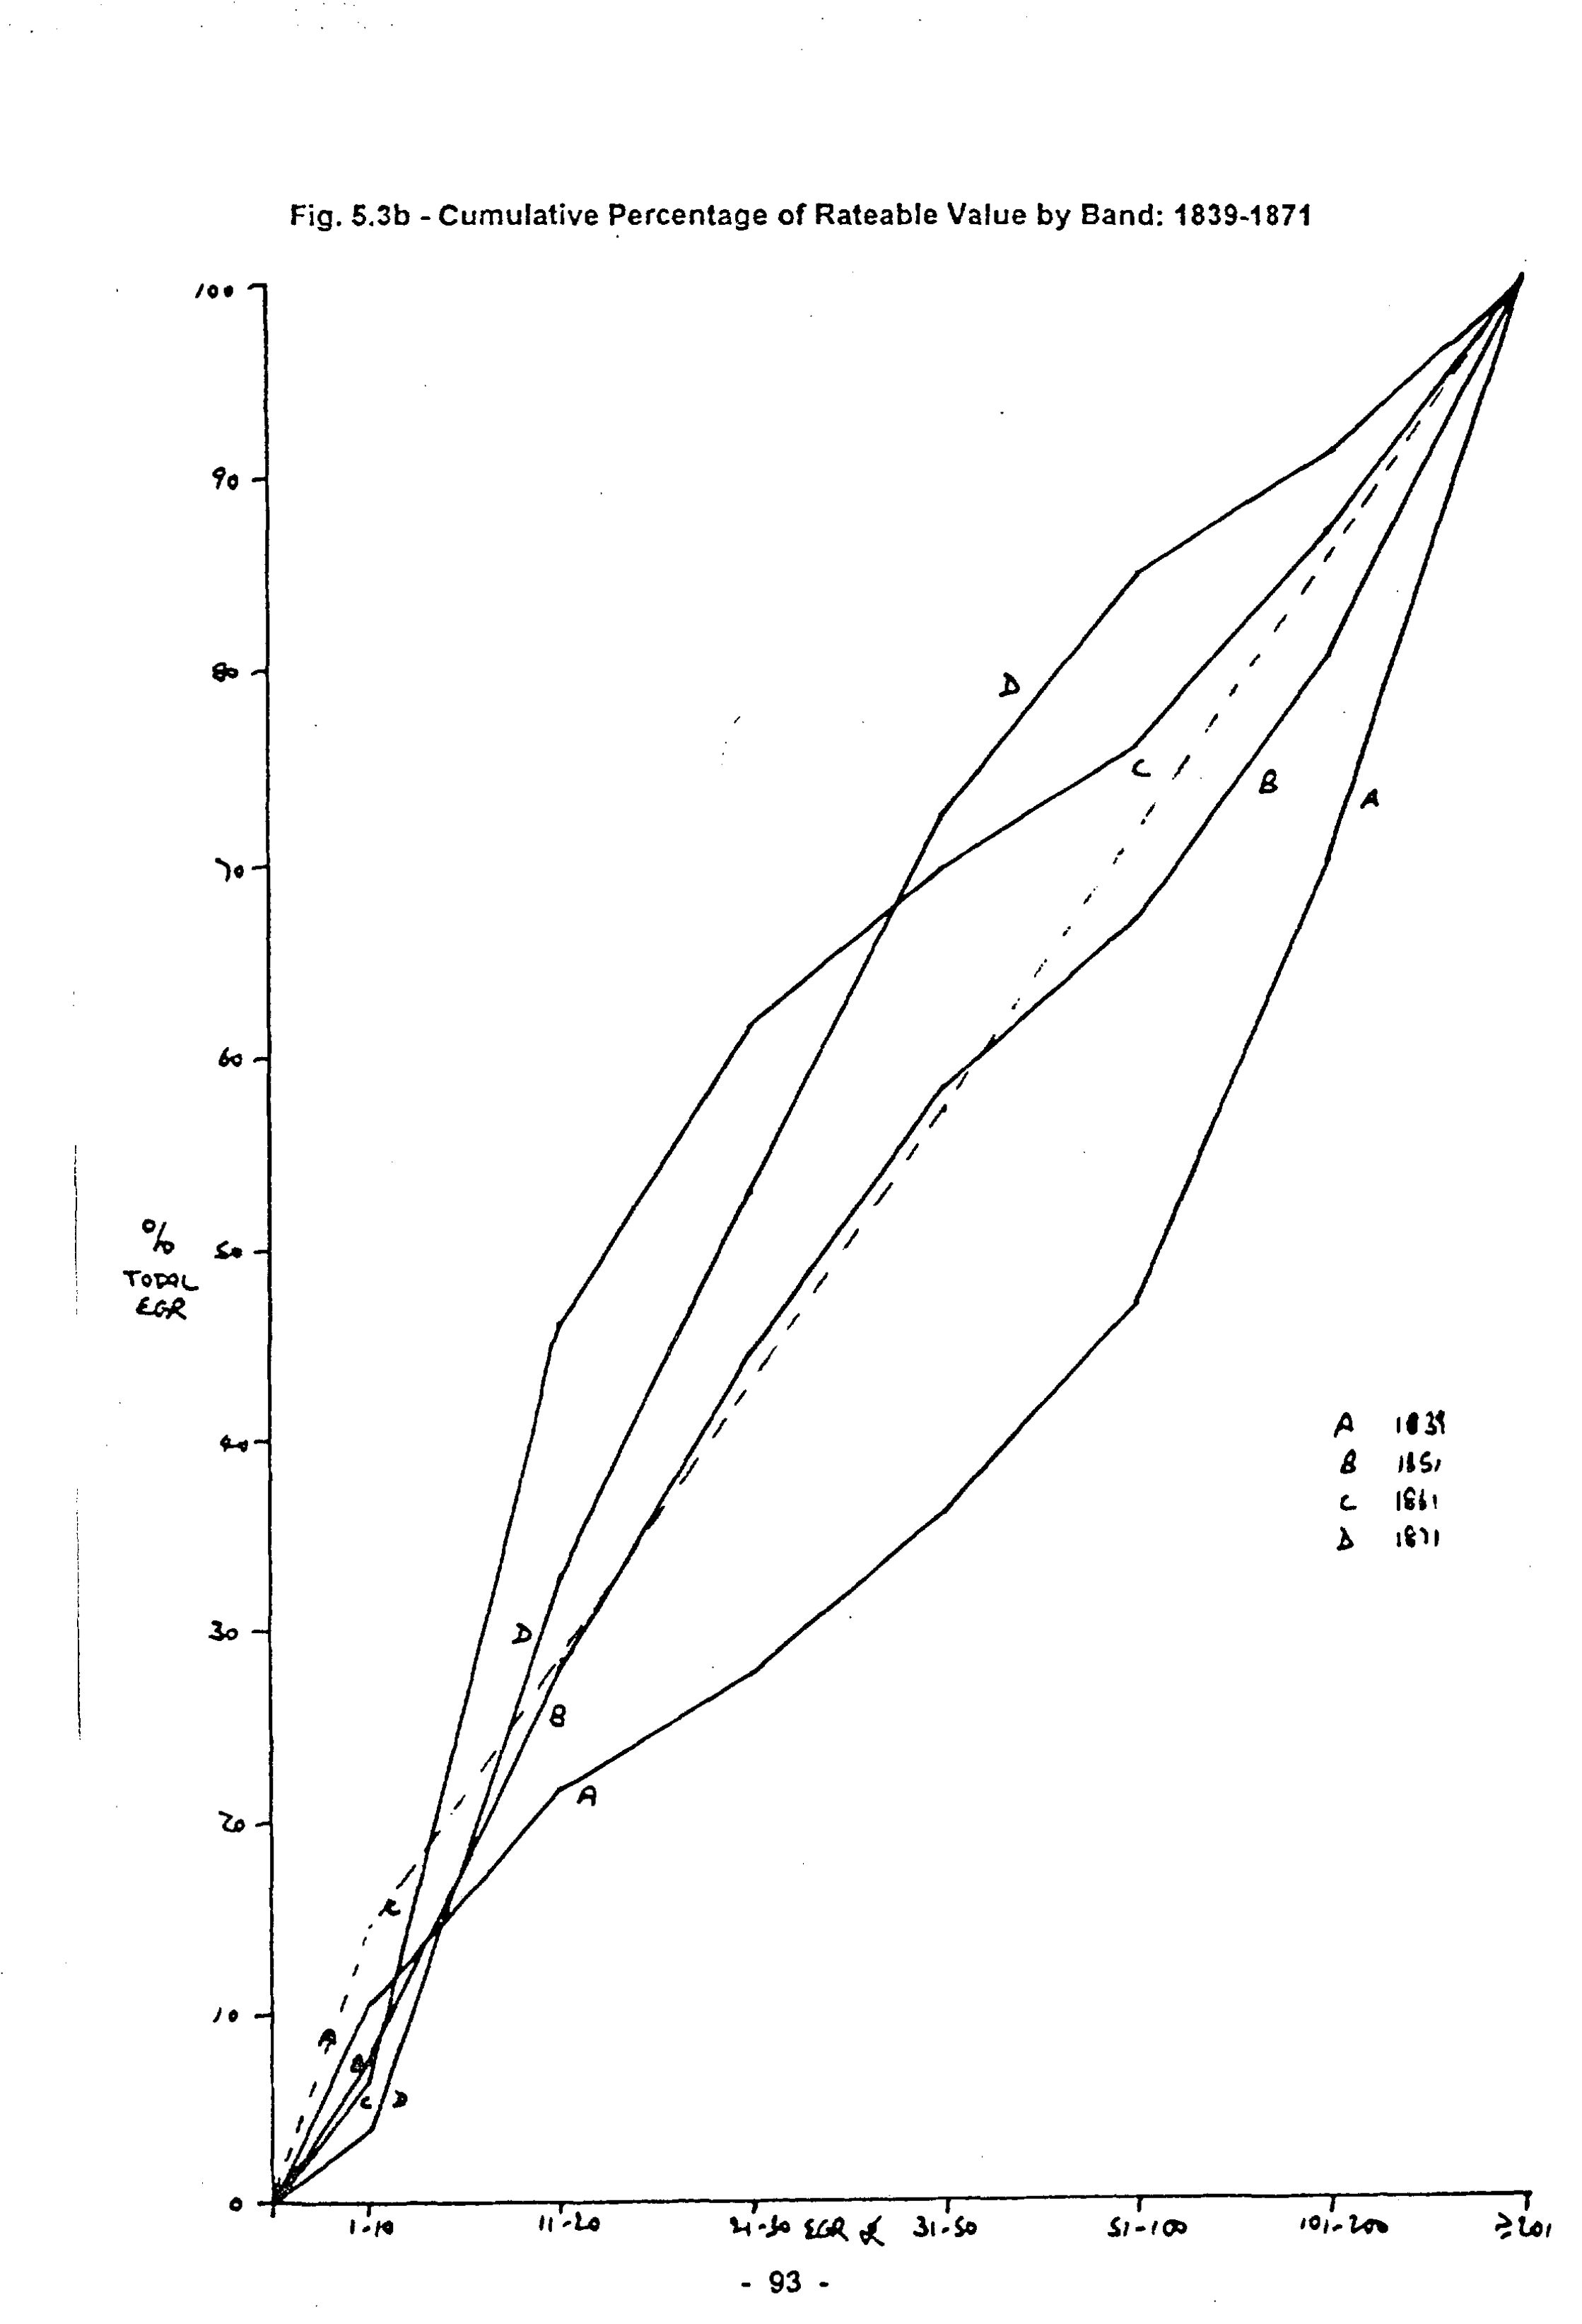
In 1839 (Table 2.5), houses with EGRs of £1-10 formed 42% of the total, but only 11% of the EGR. Houses worth less than £20 p.a. (7s 8d./week) account for 70%, contributing only 22% of the value, whereas the 9% of houses with EGRs of more than £100 yielded 53%. Houses accounted for only 57% of the total rental value of £61,636, Battersea had scarcely begun the transition to a suburb, industry and agriculture accounting for the balance. The modal EGR was £10 (3s 10d/ week), with 161 houses (16%); 387 houses (38.5%) fell in the £9-12 range, indicating that the kind of property for which Battersea was later noted was already present in large quantities. The median, lower and upper quartile EGRs were £12, £9 and £27.
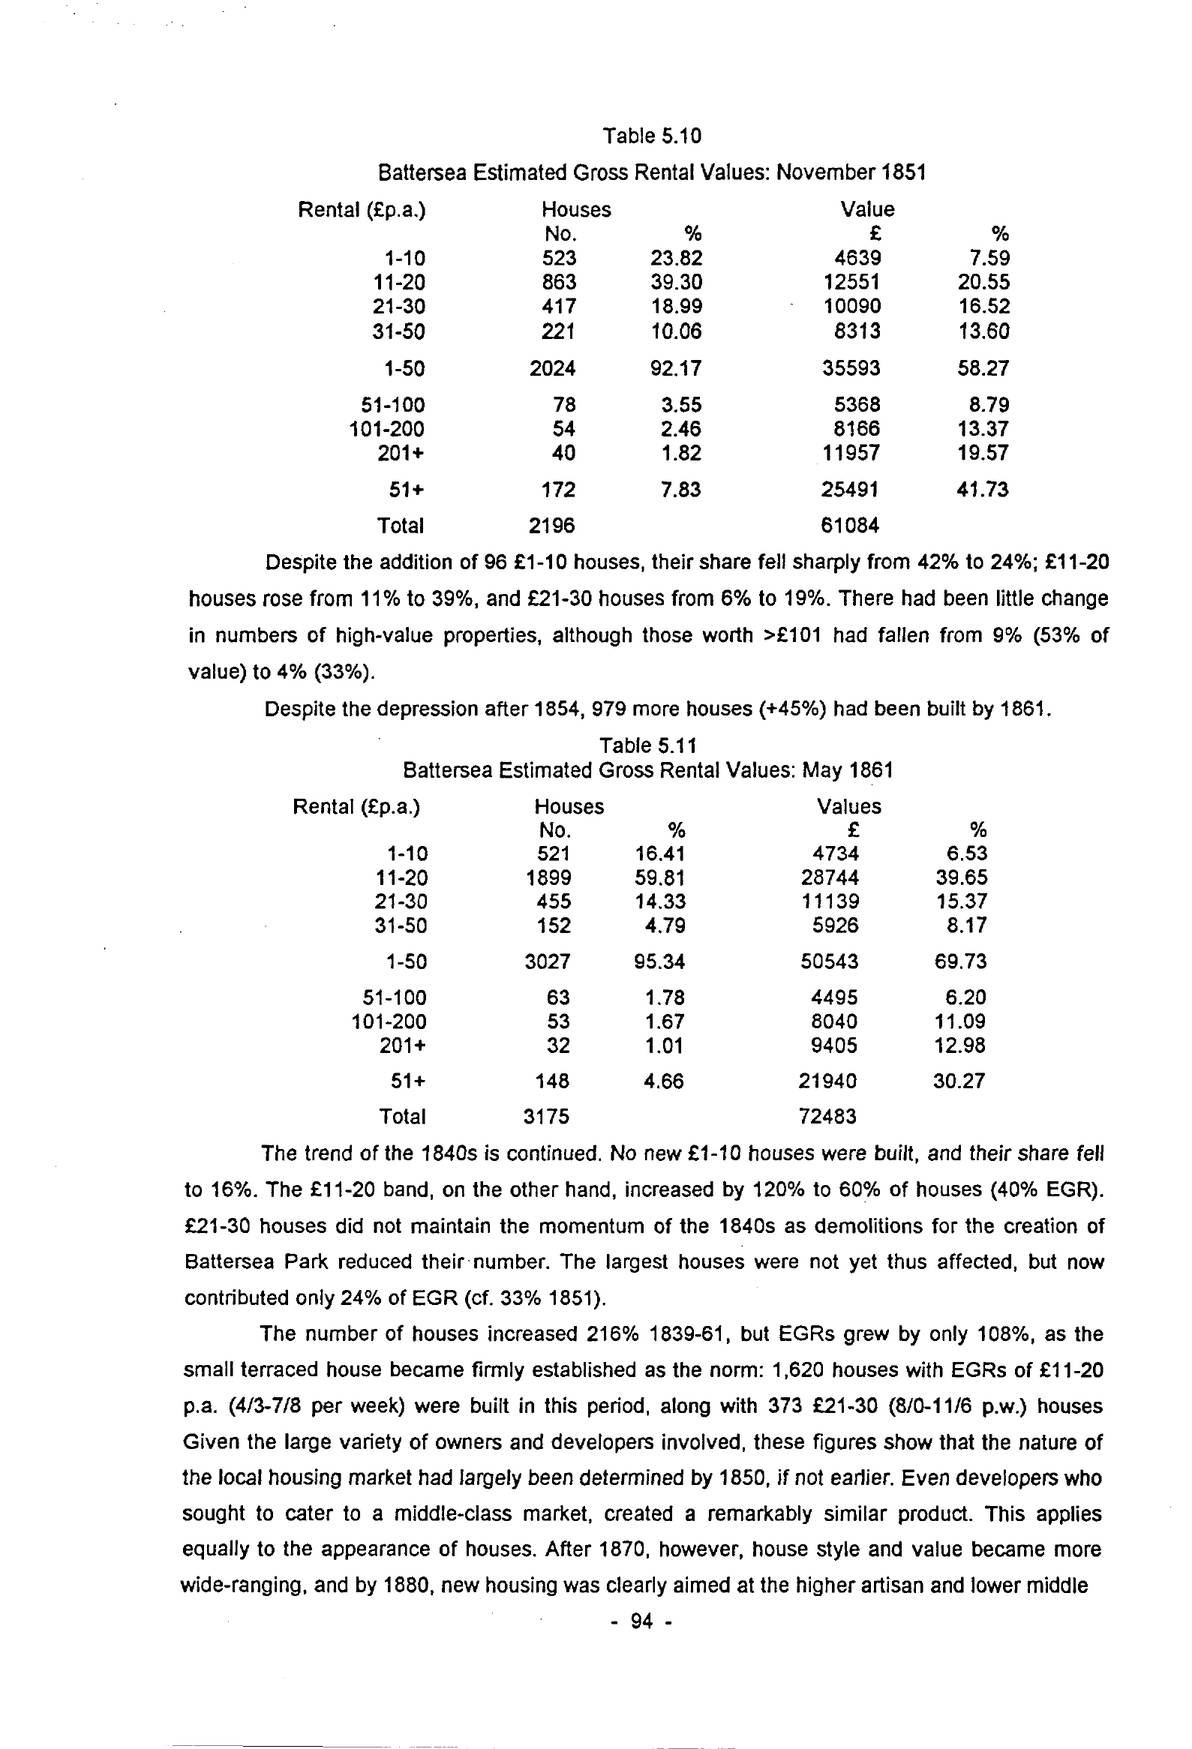
By 1851, the number of houses more than doubled to 2,196, although the total EGR was only 75% higher. £11-20 houses had increased threefold, those in the £21-30 band fivefold, setting a pattern which continued until the 1880s.
Open zoomable view
Open zoomable view
| Rental (£p.a.) | Houses | Value | ||
|---|---|---|---|---|
| No. | % | £ | % | |
| 1-10 | 523 | 23.82 | 4639 | 7.59 |
| 11-20 | 863 | 39.30 | 12551 | 20.55 |
| 21-30 | 417 | 18.99 | 10090 | 16.52 |
| 31-50 | 221 | 10.06 | 8313 | 13.60 |
| 1-50 | 2024 | 92.17 | 35593 | 58.27 |
| 51-100 | 78 | 3.55 | 5368 | 8.79 |
| 101-200 | 54 | 2.46 | 8166 | 13.37 |
| 201+ | 40 | 1.82 | 11957 | 19.57 |
| 51+ | 172 | 7.83 | 25491 | 41.73 |
| Total | 2196 | 61084 |
Despite the addition of 96 £1-10 houses, their share fell sharply from 42% to 24%; £11-20 houses rose from 11% to 39%, and £21-30 houses from 6% to 19%. There had been little change in numbers of high-value properties, although those worth >£101 had fallen from 9% (53% of value) to 4% (33%).
Despite the depression after 1854, 979 more houses (+45%) had been built by 1861.
| Rental (£p.a.) | Houses | Values | ||
|---|---|---|---|---|
| No. | % | £ | % | |
| 1-10 | 521 | 16.41 | 4734 | 6.53 |
| 11-20 | 1899 | 59.81 | 28744 | 39.65 |
| 21-30 | 455 | 14.33 | 11139 | 15.37 |
| 31-50 | 152 | 4.79 | 5926 | 8.17 |
| 1-50 | 3027 | 95.34 | 50543 | 69.73 |
| 51-100 | 63 | 1.78 | 4495 | 6.20 |
| 101-200 | 53 | 1.67 | 8040 | 11.09 |
| 201+ | 32 | 1.01 | 9405 | 12.98 |
| 51+ | 148 | 4.66 | 21940 | 30.27 |
| Total | 3175 | 72483 |
The trend of the 1840s is continued. No new £1-10 houses were built, and their share fell to 16%. The £11-20 band, on the other hand, increased by 120% to 60% of houses (40% EGR). £21-30 houses did not maintain the momentum of the 1840s as demolitions for the creation of Battersea Park reduced their number. The largest houses were not yet thus affected, but now contributed only 24% of EGR (cf. 33% 1851).
The number of houses increased 216% 1839-61, but EGRs grew by only 108%, as the small terraced house became firmly established as the norm: 1,620 houses with EGRs of £11-20 p.a. (4/3-7/8 per week) were built in this period, along with 373 £21-30 (8/0-11/6 p.w.) houses Given the large variety of owners and developers involved, these figures show that the nature of the local housing market had largely been determined by 1850, if not earlier. Even developers who sought to cater to a middle-class market, created a remarkably similar product. This applies equally to the appearance of houses. After 1870, however, house style and value became more wide-ranging, and by 1880, new housing was clearly aimed at the higher artisan and lower middle
p. 95class tenant/owner.
More than 6,000 houses were built during the first major peak in Battersea, two-thirds of them with £1-30 EGRs. Overbuilding towards the end of the 1860s meant that 1,400 houses were empty in the 1871 Census, falling to around 700 that autumn.
| Rental (£p.a.) | Houses | Value | ||
|---|---|---|---|---|
| No. | % | £ | % | |
| 1-10 | 983 | 11.45 | 8714 | 3.89 |
| 11-20 | 4136 | 48.18 | 65876 | 29.42 |
| 21-30 | 1694 | 19.73 | 43977 | 19.64 |
| 31-50 | 1180 | 13.74 | 43480 | 19.41 |
| 1-50 | 7993 | 93.10 | 162047 | 72.36 |
| 51-100 | 429 | 5.00 | 27994 | 12.50 |
| 101-200 | 105 | 1.22 | 14212 | 6.35 |
| 201+ | 58 | 0.68 | 19691 | 8.79 |
| 51+ | 592 | 6.90 | 61897 | 27.64 |
| Total | 8585 | 223944 |
Note: EGRs derived from rateable values using a multiplier of 1.41, based on the 1867 assessment which gives both figures.
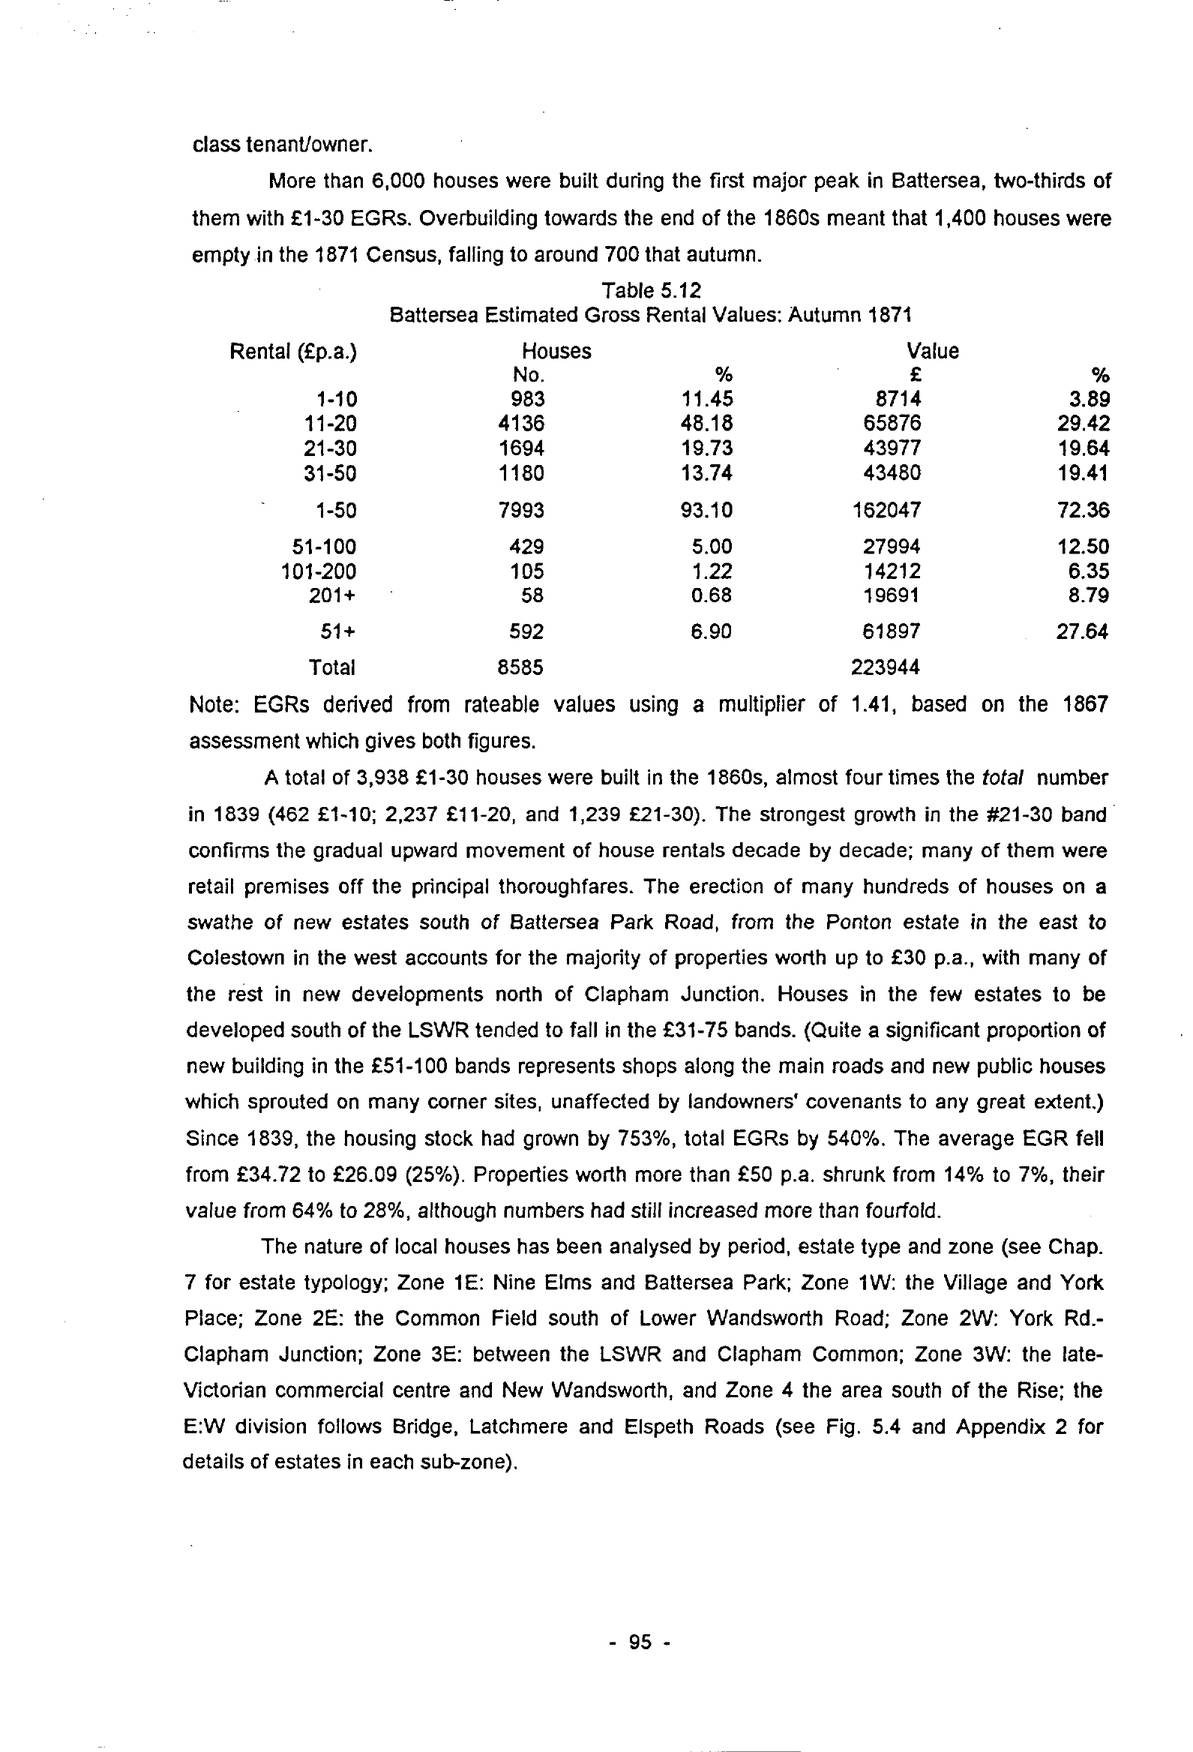
A total of 3,938 £1-30 houses were built in the 1860s, almost four times the total number in 1839 (462 £1-10; 2,237 £11-20, and 1,239 £21-30). The strongest growth in the £21-30 band confirms the gradual upward movement of house rentals decade by decade; many of them were retail premises off the principal thoroughfares. The erection of many hundreds of houses on a swathe of new estates south of Battersea Park Road, from the Ponton estate in the east to Colestown in the west accounts for the majority of properties worth up to £30 p.a., with many of the rest in new developments north of Clapham Junction. Houses in the few estates to be developed south of the LSWR tended to fall in the £31-75 bands. (Quite a significant proportion of new building in the £51-100 bands represents shops along the main roads and new public houses which sprouted on many corner sites, unaffected by landowners’ covenants to any great extent.) Since 1839, the housing stock had grown by 753%, total EGRs by 540%. The average EGR fell from £34.72 to £26.09 (25%). Properties worth more than £50 p.a. shrunk from 14% to 7%, their value from 64% to 28%, although numbers had still increased more than fourfold.
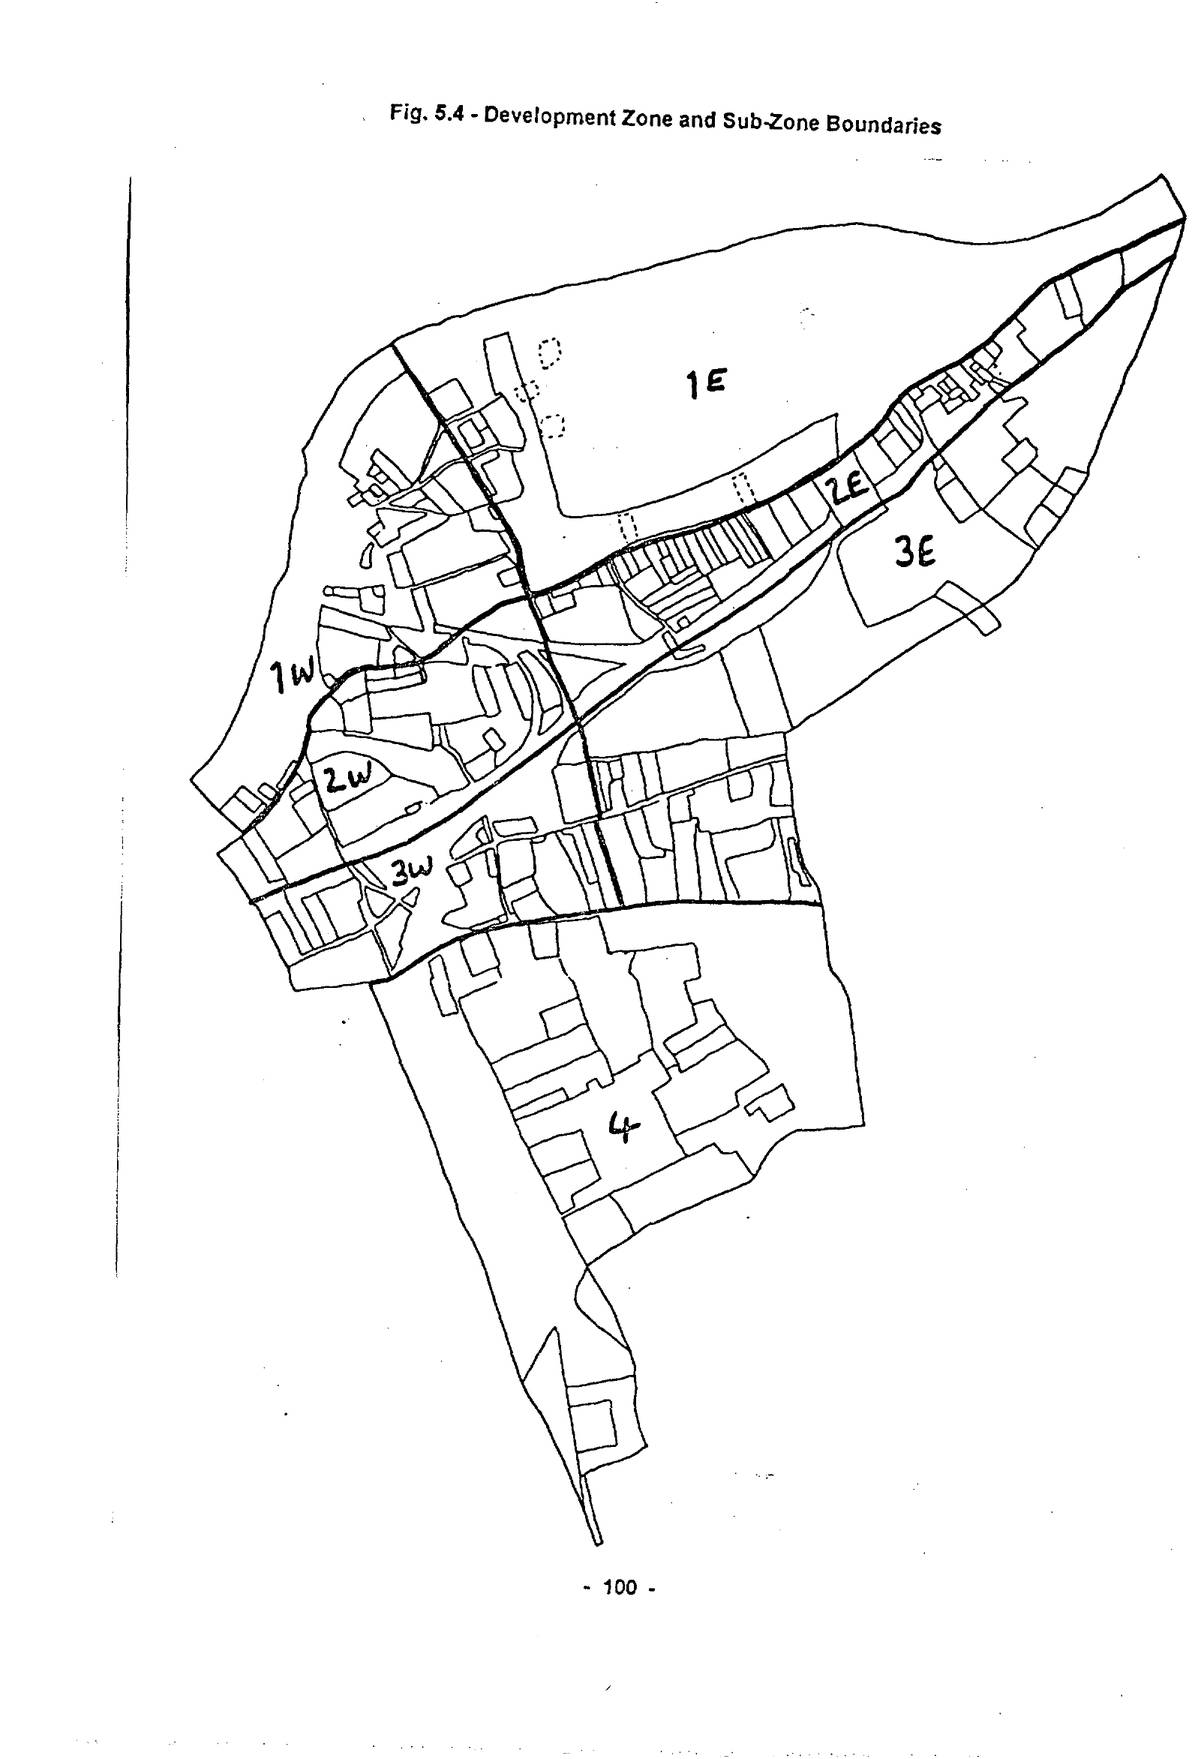
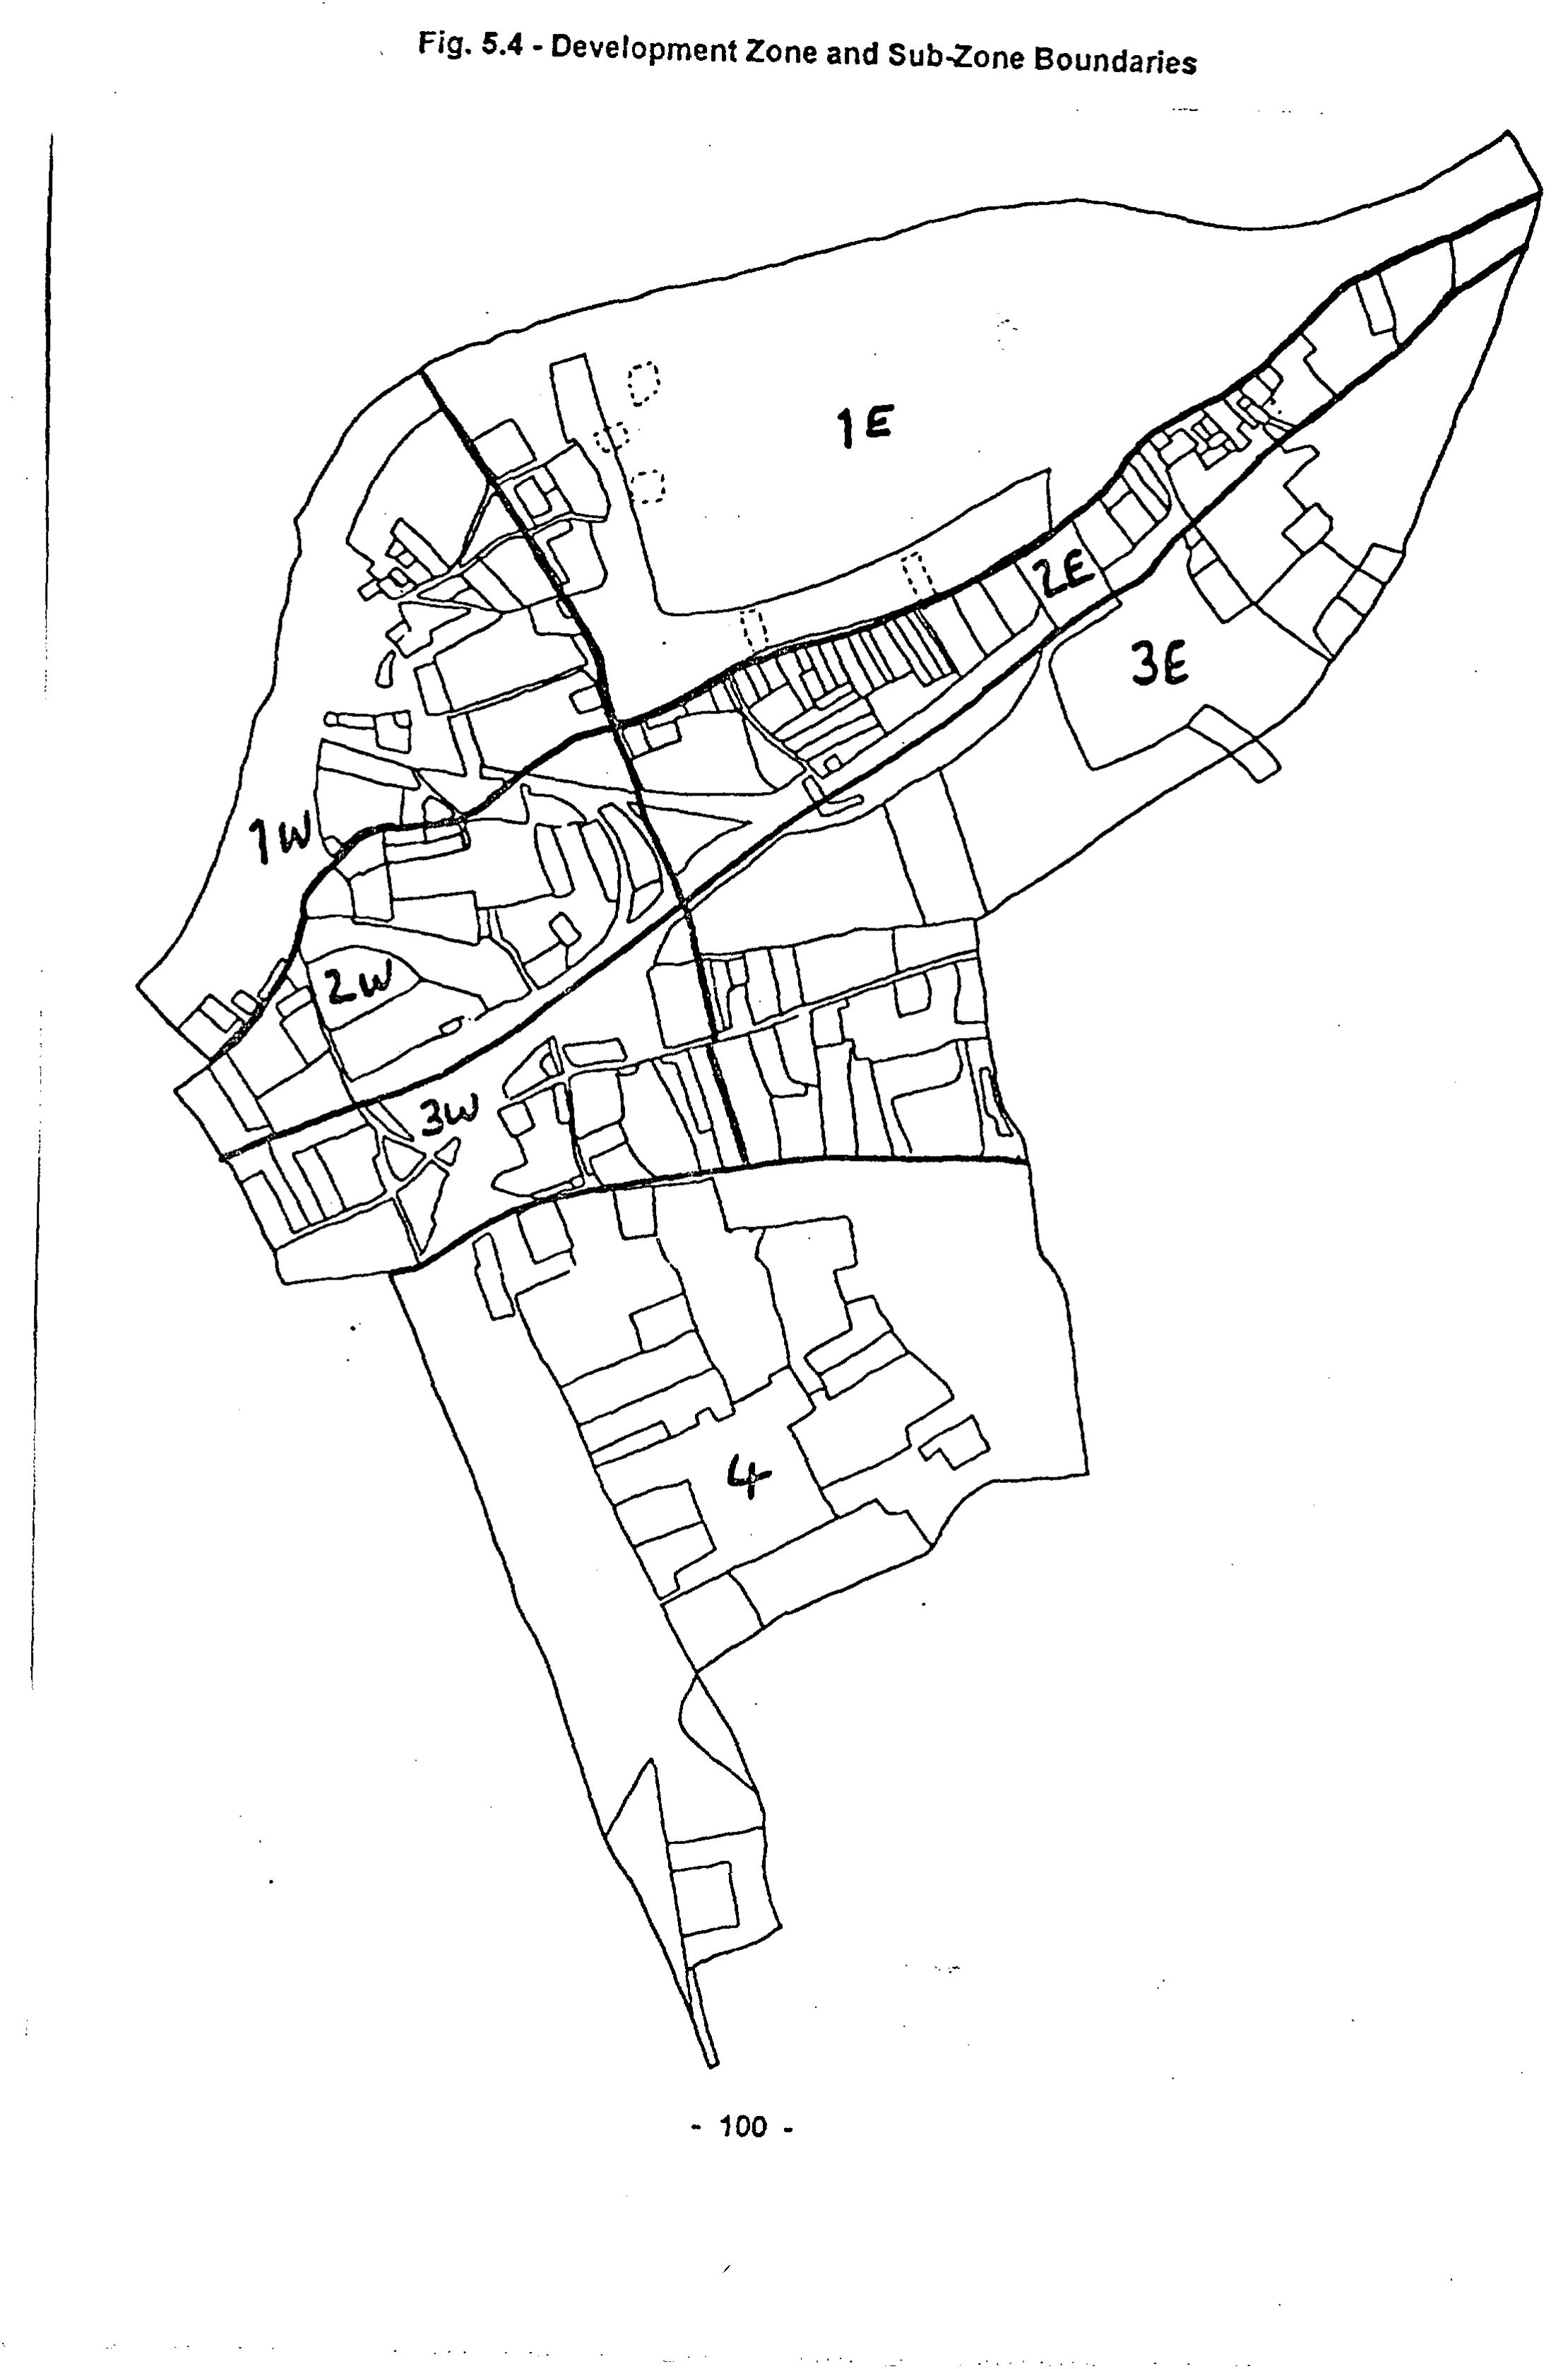
The nature of local houses has been analysed by period, estate type and zone (see Chap. 7 for estate typology; Zone 1E: Nine Elms and Battersea Park; Zone 1W: the Village and York Place; Zone 2E: the Common Field south of Lower Wandsworth Road; Zone 2W: York Rd.-Clapham Junction; Zone 3E: between the LSWR and Clapham Common; Zone 3W: the late-Victorian commercial centre and New Wandsworth, and Zone 4 the area south of the Rise; the E:W division follows Bridge, Latchmere and Elspeth Roads (see Fig. 5.4 and Appendix 2 for details of estates in each sub-zone).
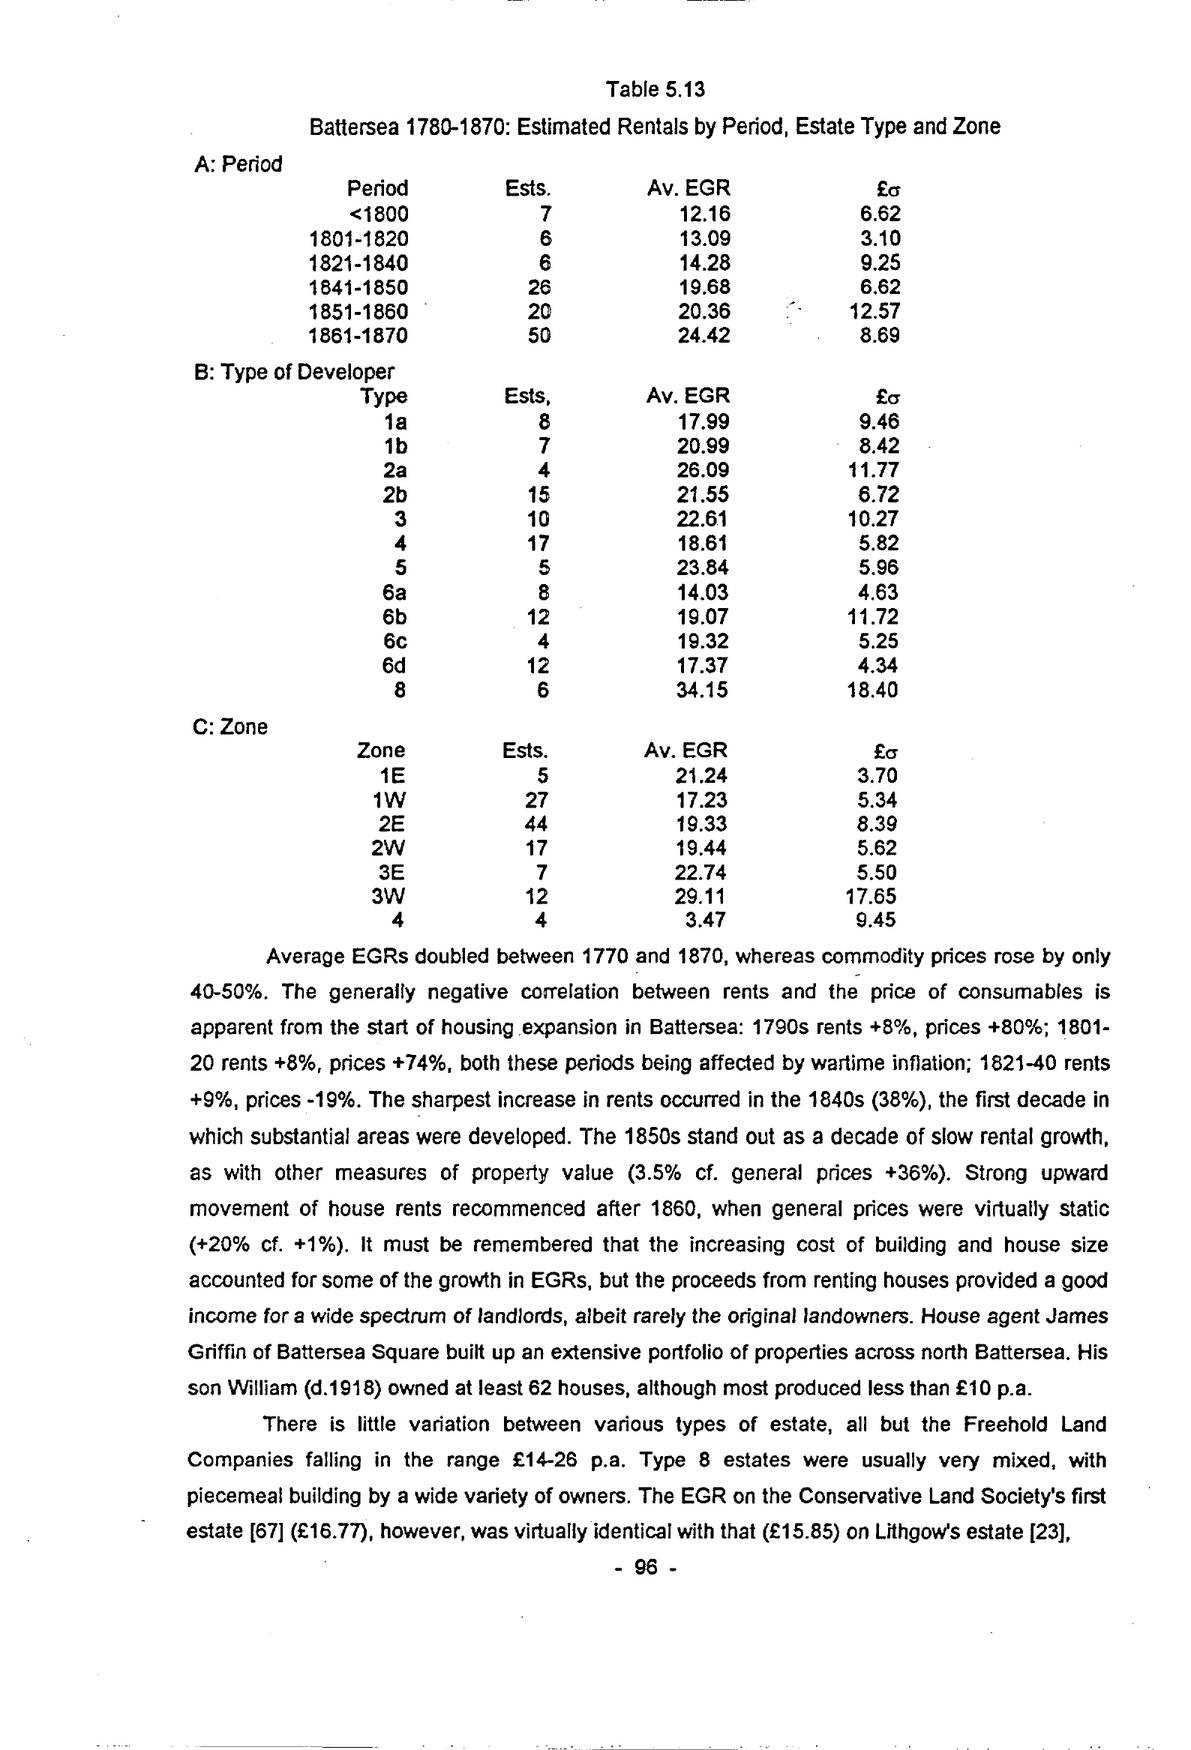
| A: Period | |||
|---|---|---|---|
| Period | Ests. | Av. EGR | £σ |
| <1800 | 7 | 12.16 | 6.62 |
| 1801-1820 | 6 | 13.09 | 3.10 |
| 1821-1840 | 6 | 14.28 | 9.25 |
| 1841-1850 | 26 | 19.68 | 6.62 |
| 1851-1860 | 20 | 20.36 | 12.57 |
| 1861-1870 | 50 | 24.42 | 8.69 |
| B: Type of Developer | |||
| Type | Ests, | Av. EGR | £σ |
| 1a | 8 | 17.99 | 9.46 |
| 1b | 7 | 20.99 | 8.42 |
| 2a | 4 | 26.09 | 11.77 |
| 2b | 15 | 21.55 | 6.72 |
| 3 | 10 | 22.61 | 10.27 |
| 4 | 17 | 18.61 | 5.82 |
| 5 | 5 | 23.84 | 5.96 |
| 6a | 8 | 14.03 | 4.63 |
| 6b | 12 | 19.07 | 11.72 |
| 6c | 4 | 19.32 | 5.25 |
| 6d | 12 | 17.37 | 4.34 |
| 8 | 6 | 34.15 | 18.40 |
| C: Zone | |||
| Zone | Ests. | Av. EGR | £σ |
| 1E | 5 | 21.24 | 3.70 |
| 1W | 27 | 17.23 | 5.34 |
| 2E | 44 | 19.33 | 8.39 |
| 2W | 17 | 19.44 | 5.62 |
| 3E | 7 | 22.74 | 5.50 |
| 3W | 12 | 29.11 | 17.65 |
| 4 | 4 | 3.47 | 9.45 |
Average EGRs doubled between 1770 and 1870, whereas commodity prices rose by only 40-50%. The generally negative correlation between rents and the price of consumables is apparent from the start of housing expansion in Battersea: 1790s rents +8%, prices +80%; 1801-20 rents +8%, prices +74%, both these periods being affected by wartime inflation; 1821-40 rents +9%, prices -19%. The sharpest increase in rents occurred in the 1840s (38%), the first decade in which substantial areas were developed. The 1850s stand out as a decade of slow rental growth, as with other measures of property value (3.5% cf. general prices +36%). Strong upward movement of house rents recommenced after 1860, when general prices were virtually static (+20% cf. +1%). It must be remembered that the increasing cost of building and house size accounted for some of the growth in EGRs, but the proceeds from renting houses provided a good income for a wide spectrum of landlords, albeit rarely the original landowners. House agent James Griffin of Battersea Square built up an extensive portfolio of properties across north Battersea. His son William (d.1918) owned at least 62 houses, although most produced less than £10 p.a.
There is little variation between various types of estate, all but the Freehold Land Companies falling in the range £14-26 p.a. Type 8 estates were usually very mixed, with piecemeal building by a wide variety of owners. The EGR on the Conservative Land Society’s first estate [67] (£16.77), however, was virtually identical with that (£15.85) on Lithgow’s estate [23],
p. 97from which it had been detached. Their second estate (EGR £26.30, with many three-storey houses) was also in line with its neighbours. The National Freehold Land Co.’s Chatham Road estate [67] (EGR £18.16) was an unusual departure from the normal high status of south Battersea. The lowest EGRs were Type 6a (manufacturers) estates, generally small cottages, but rarely for their own workers. Market gardeners (6d), original resident landowners (1a) and builders (4) also aimed at the £15-20 market (5/9-7/8 per week), other types at the slightly higher £21-25 band (8/0-9/7 per week).
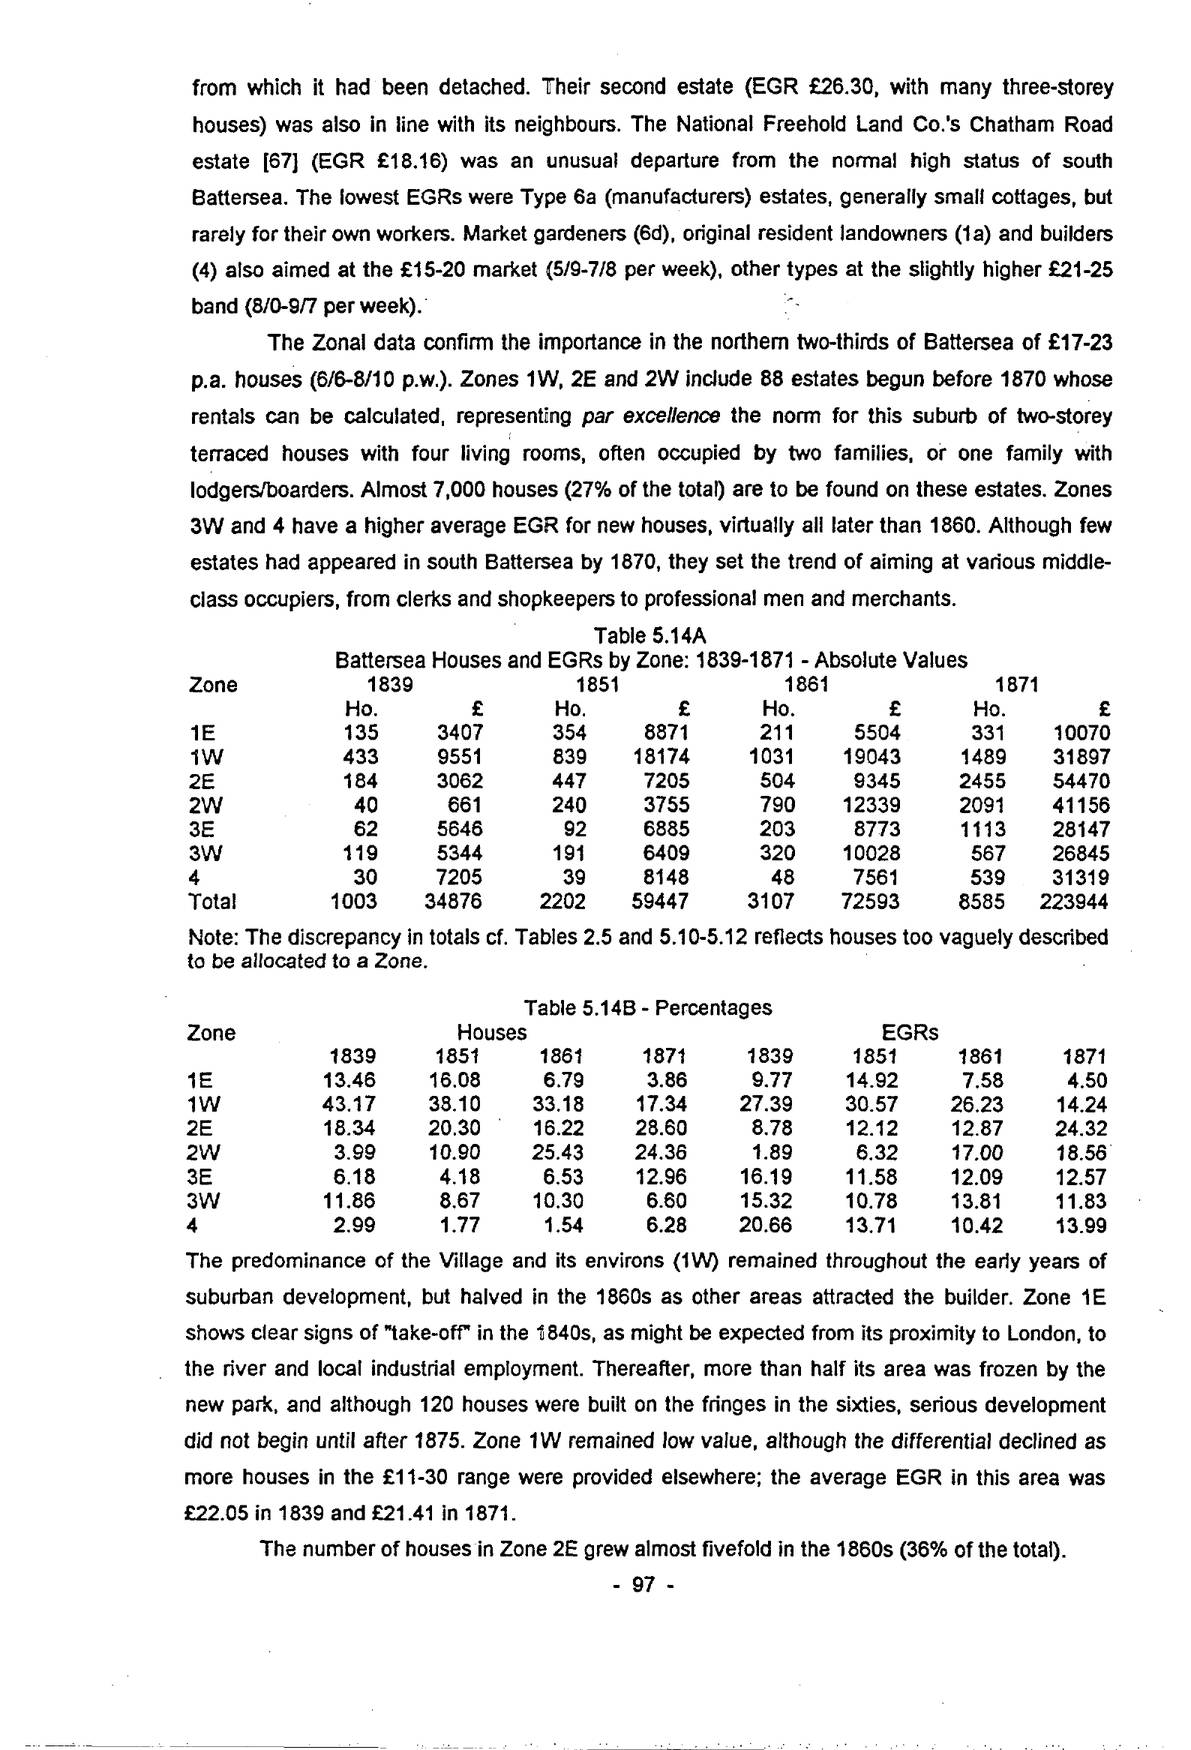
The Zonal data confirm the importance in the northern two-thirds of Battersea of £17-23 p.a. houses (6/6-8/10 p.w.). Zones 1W, 2E and 2W include 88 estates begun before 1870 whose rentals can be calculated, representing par excellence the norm for this suburb of two-storey terraced houses with four living rooms, often occupied by two families, or one family with lodgers/boarders. Almost 7,000 houses (27% of the total) are to be found on these estates. Zones 3W and 4 have a higher average EGR for new houses, virtually all later than 1860. Although few estates had appeared in south Battersea by 1870, they set the trend of aiming at various middle-class occupiers, from clerks and shopkeepers to professional men and merchants.
| Zone | 1839 | 1851 | 1861 | 1871 | ||||
|---|---|---|---|---|---|---|---|---|
| Ho. | £ | Ho. | £ | Ho. | £ | Ho. | £ | |
| 1E | 135 | 3407 | 354 | 8871 | 211 | 5504 | 331 | 10070 |
| 1W | 433 | 9551 | 839 | 18174 | 1031 | 19043 | 1489 | 31897 |
| 2E | 184 | 3062 | 447 | 7205 | 504 | 9345 | 2455 | 54470 |
| 2W | 40 | 661 | 240 | 3755 | 790 | 12339 | 2091 | 41156 |
| 3E | 62 | 5646 | 92 | 6885 | 203 | 8773 | 1113 | 28147 |
| 3W | 119 | 5344 | 191 | 6409 | 320 | 10028 | 567 | 26845 |
| 4 | 30 | 7205 | 39 | 8148 | 48 | 7561 | 539 | 31319 |
| Total | 1003 | 34876 | 2202 | 59447 | 3107 | 72593 | 8585 | 223944 |
Note: The discrepancy in totals cf. Tables 2.5 and 5.10-5.12 reflects houses too vaguely described to be allocated to a Zone.
| Zone | Houses | EGRs | ||||||
|---|---|---|---|---|---|---|---|---|
| 1839 | 1851 | 1861 | 1871 | 1839 | 1851 | 1861 | 1871 | |
| 1E | 13.46 | 16.08 | 6.79 | 3.86 | 9.77 | 14.92 | 7.58 | 4.50 |
| 1W | 43.17 | 38.10 | 33.18 | 17.34 | 27.39 | 30.57 | 26.23 | 14.24 |
| 2E | 18.34 | 20.30 | 16.22 | 28.60 | 8.78 | 12.12 | 12.87 | 24.32 |
| 2W | 3.99 | 10.90 | 25.43 | 24.36 | 1.89 | 6.32 | 17.00 | 18.56 |
| 3E | 6.18 | 4.18 | 6.53 | 12.96 | 16.19 | 11.58 | 12.09 | 12.57 |
| 3W | 11.86 | 8.67 | 10.30 | 6.60 | 15.32 | 10.78 | 13.81 | 11.83 |
| 4 | 2.99 | 1.77 | 1.54 | 6.28 | 20.66 | 13.71 | 10.42 | 13.99 |
The predominance of the Village and its environs (1W) remained throughout the early years of suburban development, but halved in the 1860s as other areas attracted the builder. Zone 1E shows clear signs of “take-off” in the 1840s, as might be expected from its proximity to London, to the river and local industrial employment. Thereafter, more than half its area was frozen by the new park, and although 120 houses were built on the fringes in the sixties, serious development did not begin until after 1875. Zone 1W remained low value, although the differential declined as more houses in the £11-30 range were provided elsewhere; the average EGR in this area was £22.05 in 1839 and £21.41 in 1871.
The number of houses in Zone 2E grew almost fivefold in the 1860s (36% of the total).
p. 98The average value in 1839 was only £16.64, mostly small cottages in New Town, increasing to £22.19 in 1871. The most spectacular growth between 1841 and 1860 was in Zone 2W, paradoxically one of the furthest from London, neatly demonstrating the failure of urban growth to follow a regular annular pattern. In 1839 this area contained little but a few farms and public houses, but its fate was sealed when the Carters began build in that same year [20], followed by fellow market gardener Francis Lithgow in 1847 [23], and builder-developer John Cornelius Park after 1850 [46]. These were, however, low-value estates, containing by 1861 25% of houses, but only 17% of rental value, a pattern which changed hardly at all in the 1860s, despite the addition of 1,300 houses. Average EGRs grew from £16.63 to £19.68, 1839-71.
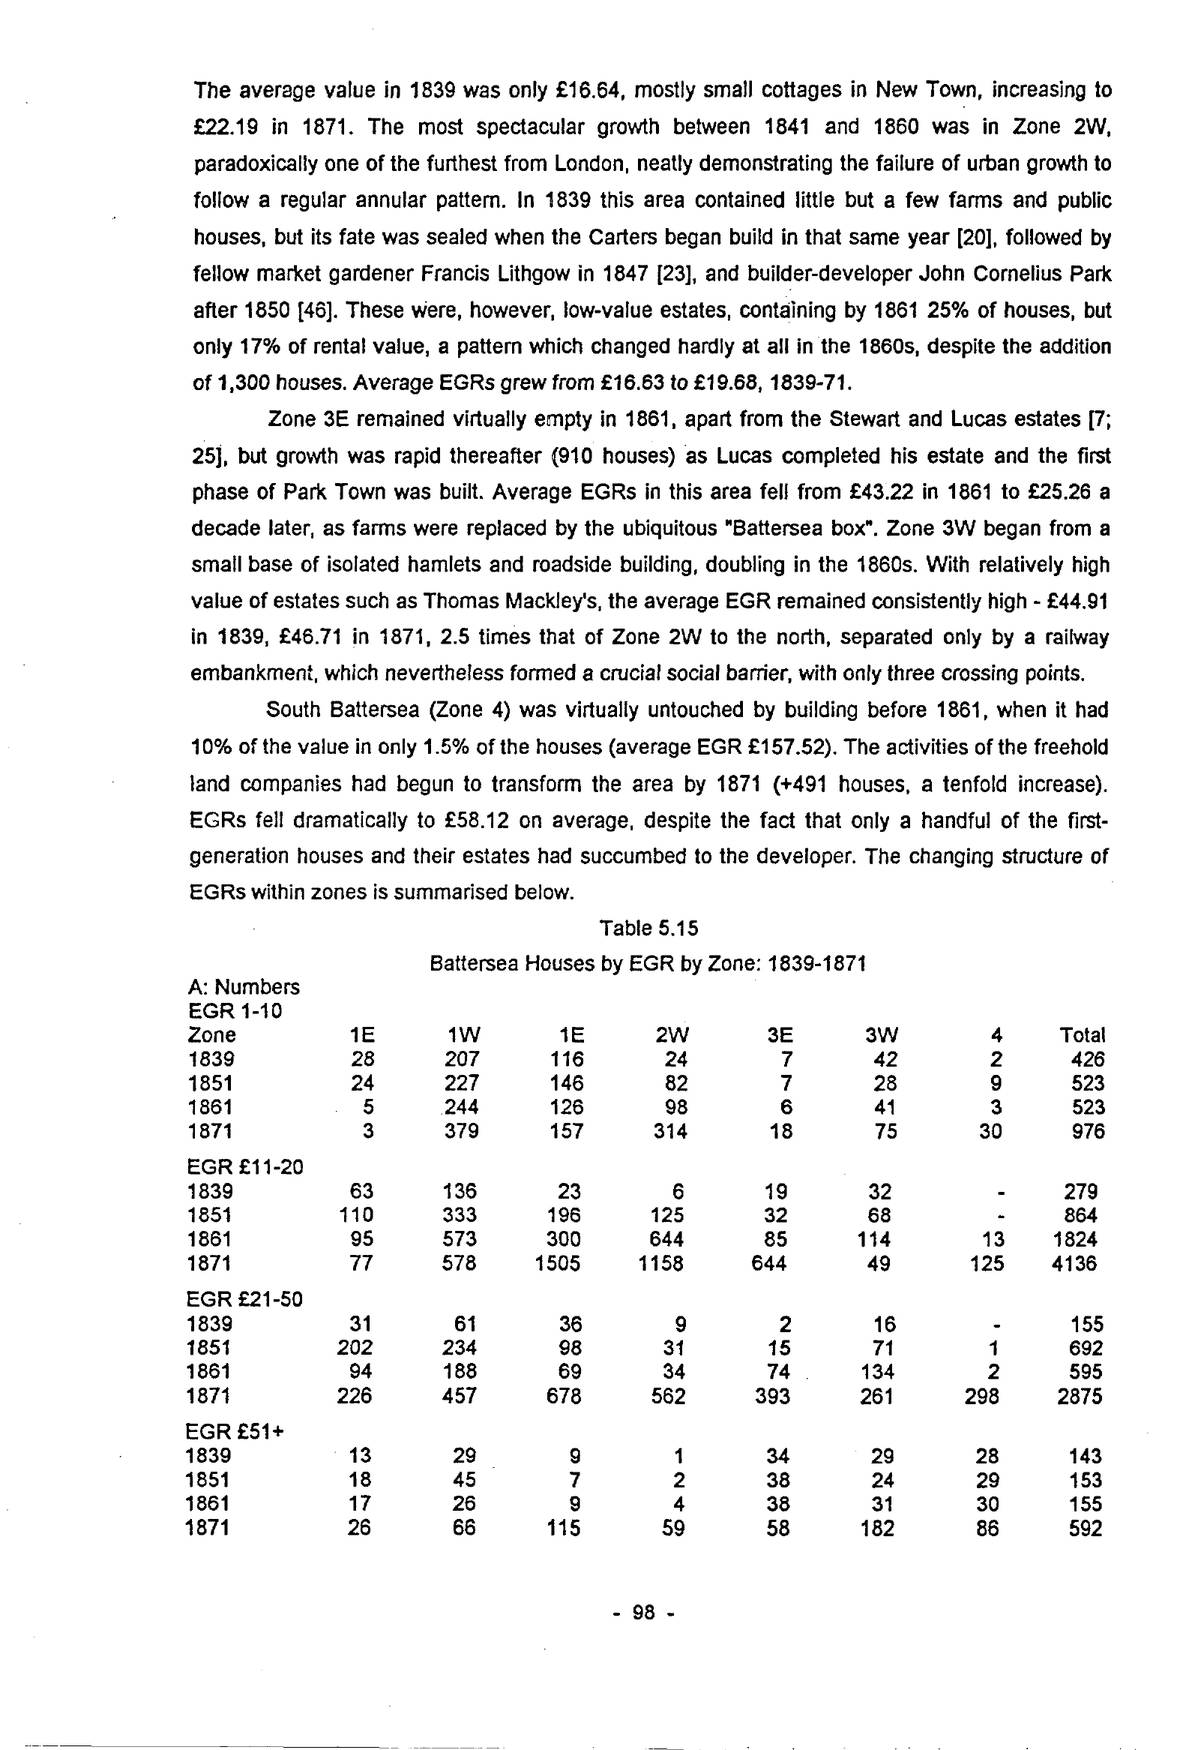
Zone 3E remained virtually empty in 1861, apart from the Stewart and Lucas estates [7; 25], but growth was rapid thereafter (910 houses) as Lucas completed his estate and the first phase of Park Town was built. Average EGRs in this area fell from £43.22 in 1861 to £25.26 a decade later, as farms were replaced by the ubiquitous “Battersea box”. Zone 3W began from a small base of isolated hamlets and roadside building, doubling in the 1860s. With relatively high value of estates such as Thomas Mackley’s, the average EGR remained consistently high – £44.91 in 1839, £46.71 in 1871, 2.5 times that of Zone 2W to the north, separated only by a railway embankment, which nevertheless formed a crucial social barrier, with only three crossing points.
South Battersea (Zone 4) was virtually untouched by building before 1861, when it had 10% of the value in only 1.5% of the houses (average EGR £157.52). The activities of the freehold land companies had begun to transform the area by 1871 (+491 houses, a tenfold increase). EGRs fell dramatically to £58.12 on average, despite the fact that only a handful of the first-generation houses and their estates had succumbed to the developer. The changing structure of EGRs within zones is summarised below.
| A: Numbers | ||||||||
|---|---|---|---|---|---|---|---|---|
| EGR 1-10 | ||||||||
| Zone | 1E | 1W | 1E | 2W | 3E | 3W | 4 | Total |
| 1839 | 28 | 207 | 116 | 24 | 7 | 42 | 2 | 426 |
| 1851 | 24 | 227 | 146 | 82 | 7 | 28 | 9 | 523 |
| 1861 | 5 | 244 | 126 | 98 | 6 | 41 | 3 | 523 |
| 1871 | 3 | 379 | 157 | 314 | 18 | 75 | 30 | 976 |
| EGR £11-20 | ||||||||
| 1839 | 63 | 136 | 23 | 6 | 19 | 32 | - | 279 |
| 1851 | 110 | 333 | 196 | 125 | 32 | 68 | - | 864 |
| 1861 | 95 | 573 | 300 | 644 | 85 | 114 | 13 | 1824 |
| 1871 | 77 | 578 | 1505 | 1158 | 644 | 49 | 125 | 4136 |
| EGR £21-50 | ||||||||
| 1839 | 31 | 61 | 36 | 9 | 2 | 16 | - | 155 |
| 1851 | 202 | 234 | 98 | 31 | 15 | 71 | 1 | 692 |
| 1861 | 94 | 188 | 69 | 34 | 74 | 134 | 2 | 595 |
| 1871 | 226 | 457 | 678 | 562 | 393 | 261 | 298 | 2875 |
| EGR £51+ | ||||||||
| 1839 | 13 | 29 | 9 | 1 | 34 | 29 | 28 | 143 |
| 1851 | 18 | 45 | 7 | 2 | 38 | 24 | 29 | 153 |
| 1861 | 17 | 26 | 9 | 4 | 38 | 31 | 30 | 155 |
| 1871 | 26 | 66 | 115 | 59 | 58 | 182 | 86 | 592 |
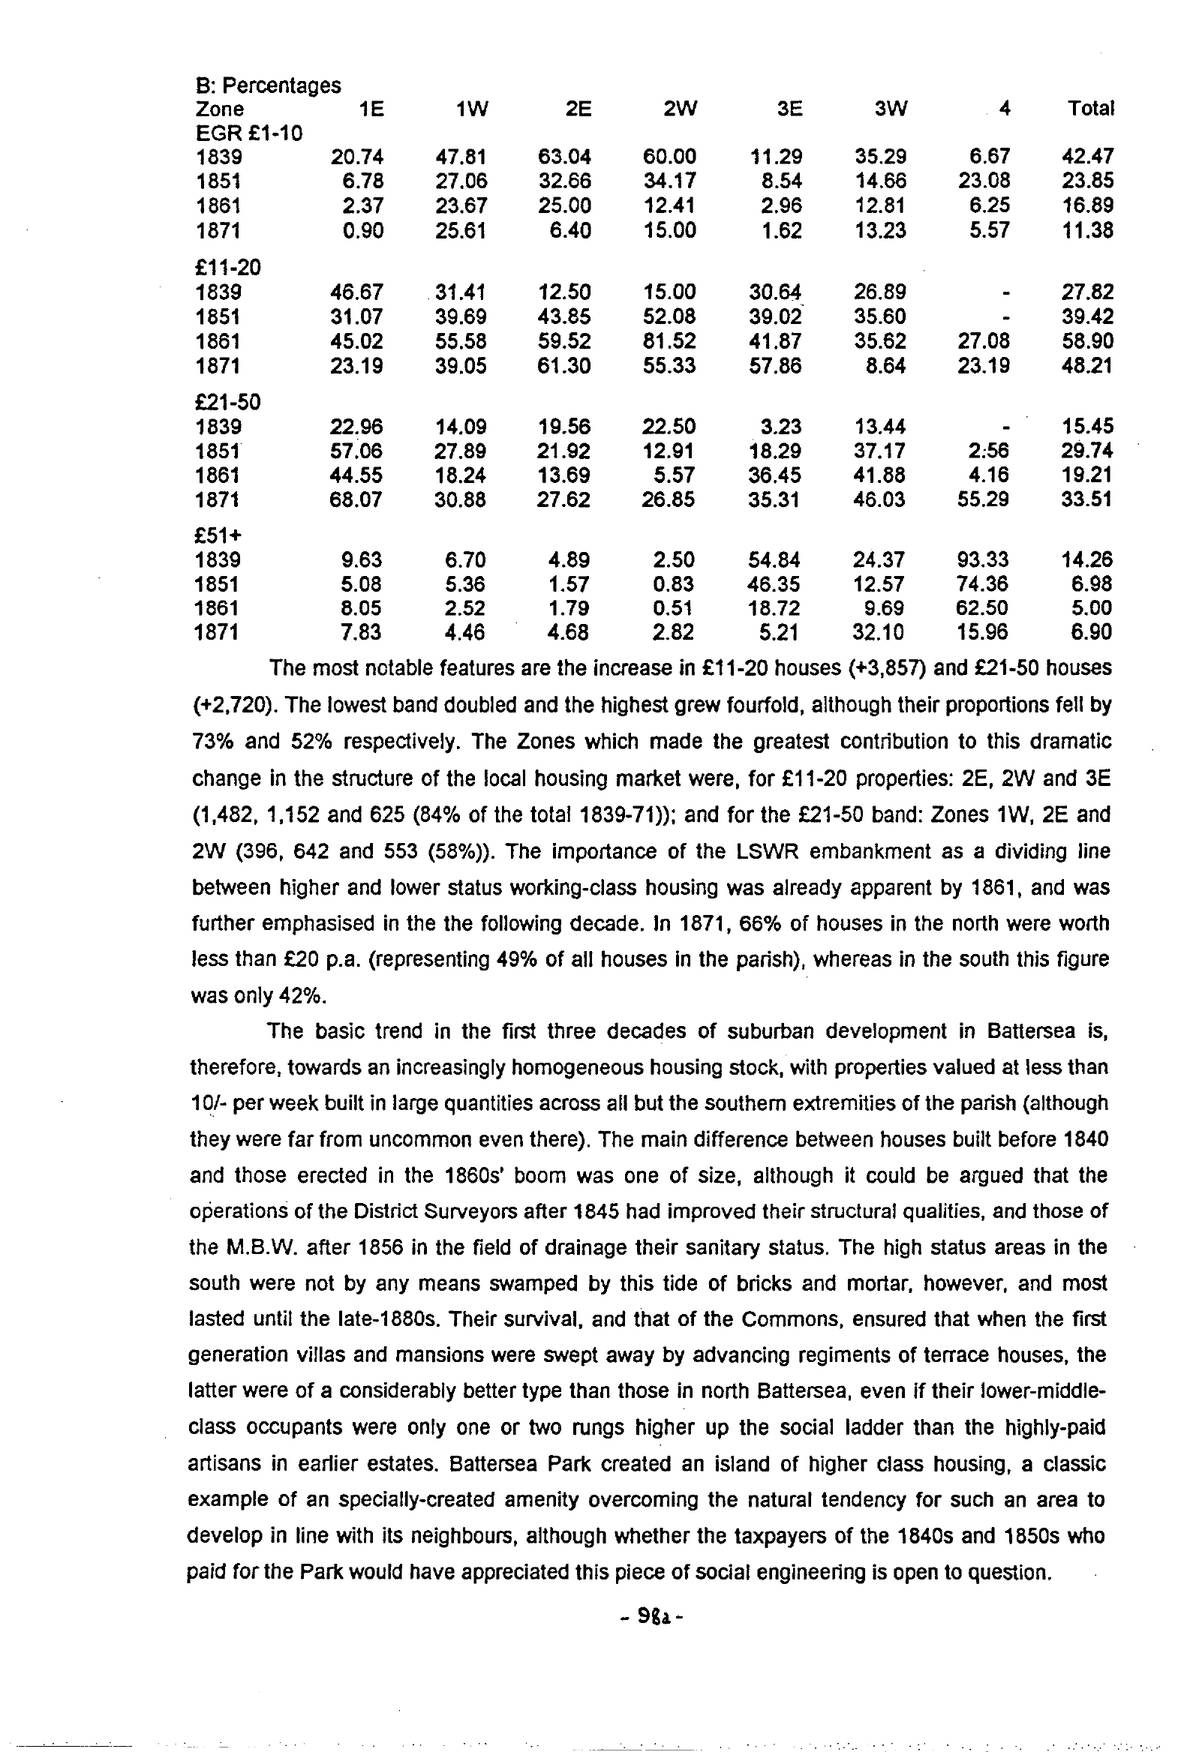
| B: Percentages | ||||||||
|---|---|---|---|---|---|---|---|---|
| Zone | 1E | 1W | 2E | 2W | 3E | 3W | 4 | Total |
| EGR £1-10 | ||||||||
| 1839 | 20.74 | 47.81 | 63.04 | 60.00 | 11.29 | 35.29 | 6.67 | 42.47 |
| 1851 | 6.78 | 27.06 | 32.66 | 34.17 | 8.54 | 14.66 | 23.08 | 23.85 |
| 1861 | 2.37 | 23.67 | 25.00 | 12.41 | 2.96 | 12.81 | 6.25 | 16.89 |
| 1871 | 0.90 | 25.61 | 6.40 | 15.00 | 1.62 | 13.23 | 5.57 | 11.38 |
| £11-20 | ||||||||
| 1839 | 46.67 | 31.41 | 12.50 | 15.00 | 30.64 | 26.89 | - | 27.82 |
| 1851 | 31.07 | 39.69 | 43.85 | 52.08 | 39.02 | 35.60 | - | 39.42 |
| 1861 | 45.02 | 55.58 | 59.52 | 81.52 | 41.87 | 35.62 | 27.08 | 58.90 |
| 1871 | 23.19 | 39.05 | 61.30 | 55.33 | 57.86 | 8.64 | 23.19 | 48.21 |
| £21-50 | ||||||||
| 1839 | 22.96 | 14.09 | 19.56 | 22.50 | 3.23 | 13.44 | - | 15.45 |
| 1851 | 57.06 | 27.89 | 21.92 | 12.91 | 18.29 | 37.17 | 2.56 | 29.74 |
| 1861 | 44.55 | 18.24 | 13.69 | 5.57 | 36.45 | 41.88 | 4.16 | 19.21 |
| 1871 | 68.07 | 30.88 | 27.62 | 26.85 | 35.31 | 46.03 | 55.29 | 33.51 |
| £51+ | ||||||||
| 1839 | 9.63 | 6.70 | 4.89 | 2.50 | 54.84 | 24.37 | 93.33 | 14.26 |
| 1851 | 5.08 | 5.36 | 1.57 | 0.83 | 46.35 | 12.57 | 74.36 | 6.98 |
| 1861 | 8.05 | 2.52 | 1.79 | 0.51 | 18.72 | 9.69 | 62.50 | 5.00 |
| 1871 | 7.83 | 4.46 | 4.68 | 2.82 | 5.21 | 32.10 | 15.96 | 6.90 |
The most notable features are the increase in £11-20 houses (+3,857) and £21-50 houses (+2,720). The lowest band doubled and the highest grew fourfold, although their proportions fell by 73% and 52% respectively. The Zones which made the greatest contribution to this dramatic change in the structure of the local housing market were, for £11-20 properties: 2E, 2W and 3E (1,482, 1,152 and 625 (84% of the total 1839-71)); and for the £21-50 band: Zones 1W, 2E and 2W (396, 642 and 553 (58%)). The importance of the LSWR embankment as a dividing line between higher and lower status working-class housing was already apparent by 1861, and was further emphasised in the the following decade. In 1871, 66% of houses in the north were worth less than £20 p.a. (representing 49% of all houses in the parish), whereas in the south this figure was only 42%.
The basic trend in the first three decades of suburban development in Battersea is, therefore, towards an increasingly homogeneous housing stock, with properties valued at less than 10/- per week built in large quantities across all but the southern extremities of the parish (although they were far from uncommon even there). The main difference between houses built before 1840 and those erected in the 1860s’ boom was one of size, although it could be argued that the operations of the District Surveyors after 1845 had improved their structural qualities, and those of the M.B.W. after 1856 in the field of drainage their sanitary status. The high status areas in the south were not by any means swamped by this tide of bricks and mortar, however, and most lasted until the late-1880s. Their survival, and that of the Commons, ensured that when the first generation villas and mansions were swept away by advancing regiments of terrace houses, the latter were of a considerably better type than those in north Battersea, even if their lower-middle-class occupants were only one or two rungs higher up the social ladder than the highly-paid artisans in earlier estates. Battersea Park created an island of higher class housing, a classic example of an specially-created amenity overcoming the natural tendency for such an area to develop in line with its neighbours, although whether the taxpayers of the 1840s and 1850s who paid for the Park would have appreciated this piece of social engineering is open to question.
p. 99
VII: Property Values 1835-1914 – A Summary
Each measure of property values reveals a different rate of growth. In some the building recessions of the 1850s and 1870s slowed or even reversed the upward trend, followed by strong upward surges in the 1860s and 1880s. Between 1840 and 1900, the sale value of land grew by about 250%, ground rentals by 100% and property prices by 167% (105% excluding multiple sales), during a period when general prices fell by 11% (26% between 1840-90, followed by a decade of little change, then a sharp upturn to 1914).23 Taking Battersea as a whole, and ignoring existing buildings and non-residential activity, the value of land rose from about £0.14m. in 1835 to £3.11m. in the 1880s. The value of property built 1840-1900 was about £6.97m. at 1900 prices. Construction costs, at £100-200 per house represent an investment of £2.55-5.10m, giving a return of 37-173% (1.0-4.6% p.a. at the average length of purchase), confirming the relatively low and uncertain profits to be made from housebuilding.
Estimated gross rentals also grew over the years, albeit much less than the housing stock, as thousands of low-value properties built after 1840 progressively swamped the great pre-urban houses. The smallest properties worth less than £10 p.a. were characteristic of village Battersea, and few were built after 1840. Average EGR fell from £34.72 in 1839 to £26.09 in 1871 (-25%). Taking the average “years purchase” from sales data in the Builder, the value of property based on EGRs was £1.29m. in 1839, £2.26m. in 1851 and £8.29m. in 1871.
VIII: Spatial Aspects of Building Development
In the previous sections, the chronology of housebuilding in Battersea has been considered, along with various measures of land and property values. Here we examine some of the spatial relationships, in order to see how much, or how little, suburban building in this area matches models of city development proposed inter alia by urban ecologists and geographers.24 These models suggest that the age of housing in a city decreases outwards from the centre, which is surrounded by concentric rings of broadly coeval development. Superficially, this is undoubtedly true: Victorian London encompasses Georgian London and is surrounded by vast tracts of suburbia created between 1918 and 1939. Such simplicity is, however, distorted below the macro-level by large numbers of pre-existing settlements, each of which potentially acted as a focus for its own annular pattern, producing an effect similar to throwing many stones into a pool. In addition, there are the random effects of the willingness or otherwise of landowners to develop their land, the impact of industry and transport (in Battersea a major landowner affecting the availability of land for housebuilding). Coupled with the ups and downs of the building cycle, such factors disrupt the ripple effect, and it is possible to measure the relationship between time and distance in development.
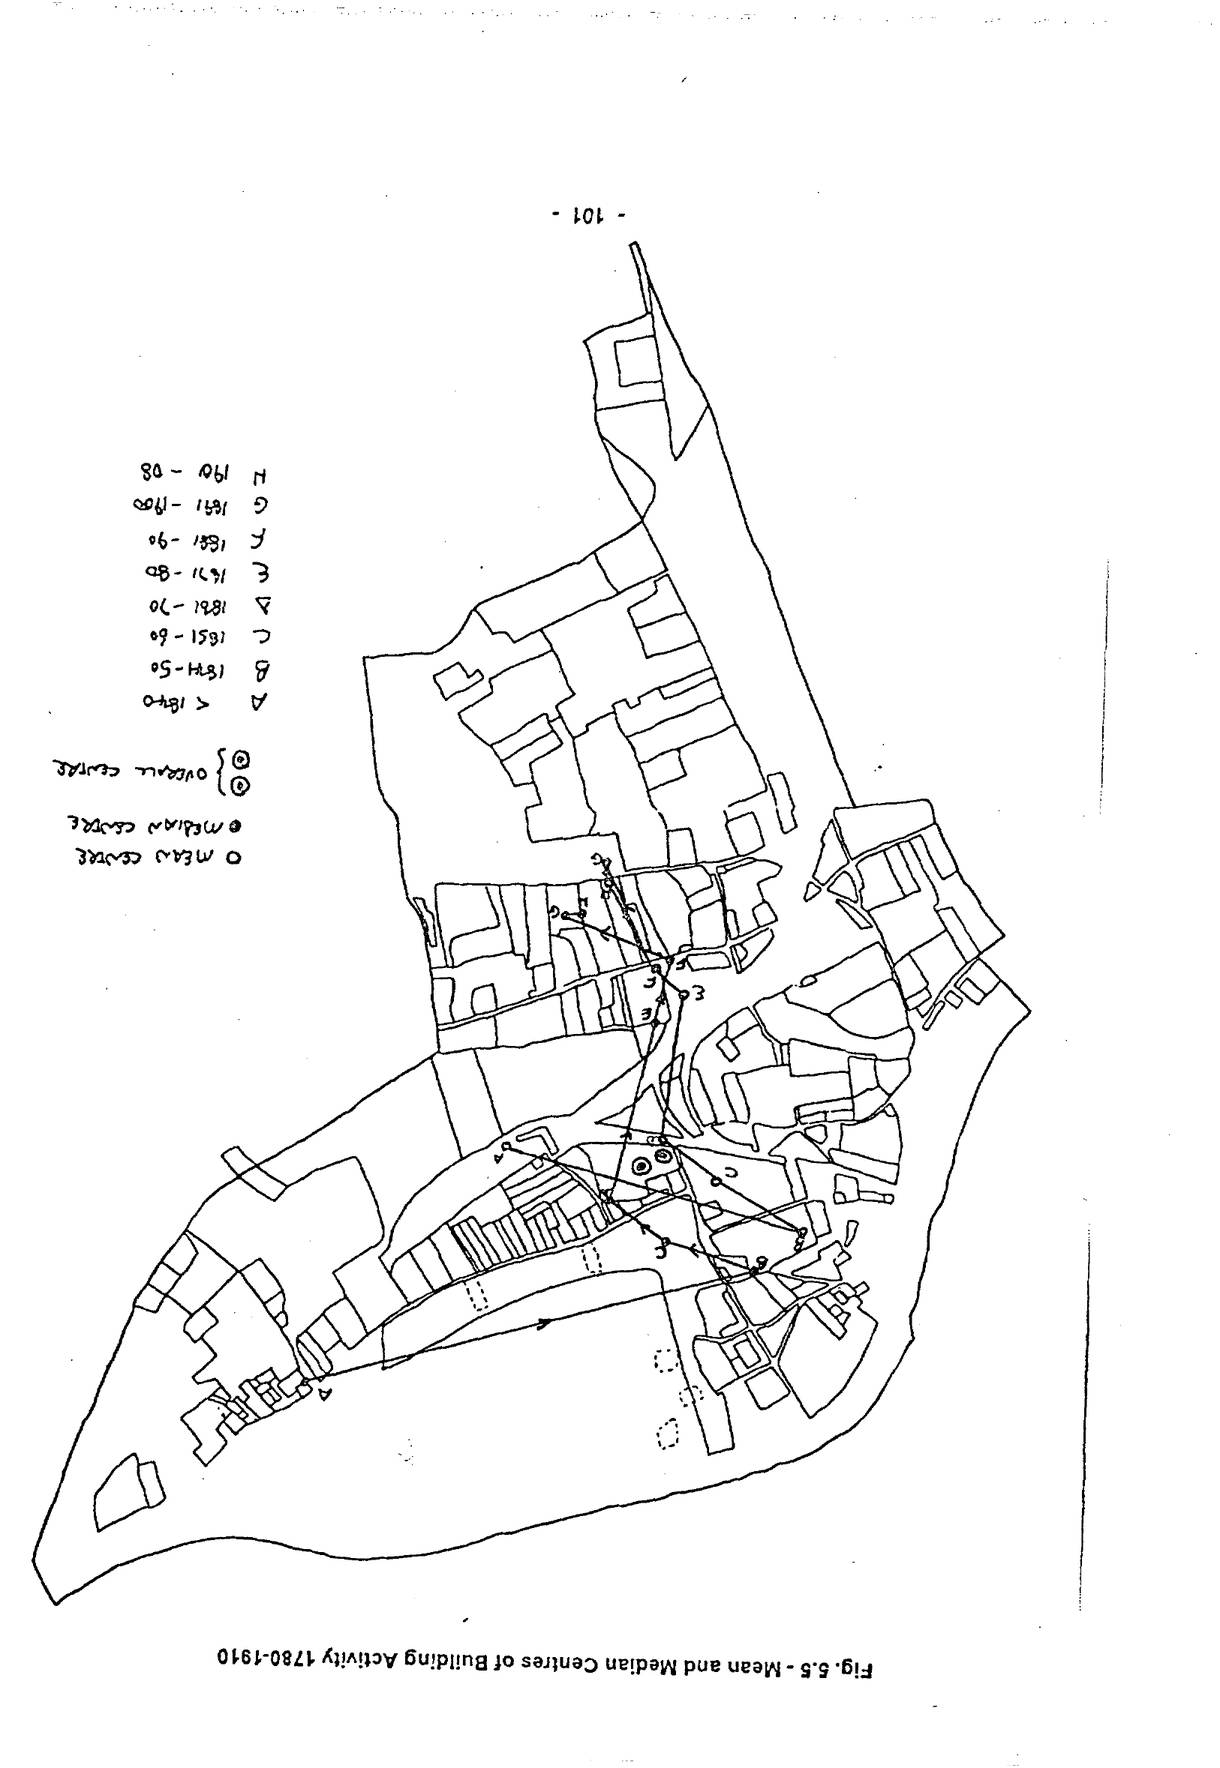
In this analysis, the distance of the centroid of each estate (most are square/rectangular and few really irregular in shape) from the Bank of England has been used, and the date is always that of the onset of development. The basic measures are the mean and median point in each decade. The first is the point of average distance from the City in each period (all estates before 1840, thereafter by decade), while the second are the coordinates which separate the estates in
Open zoomable view
Open zoomable view
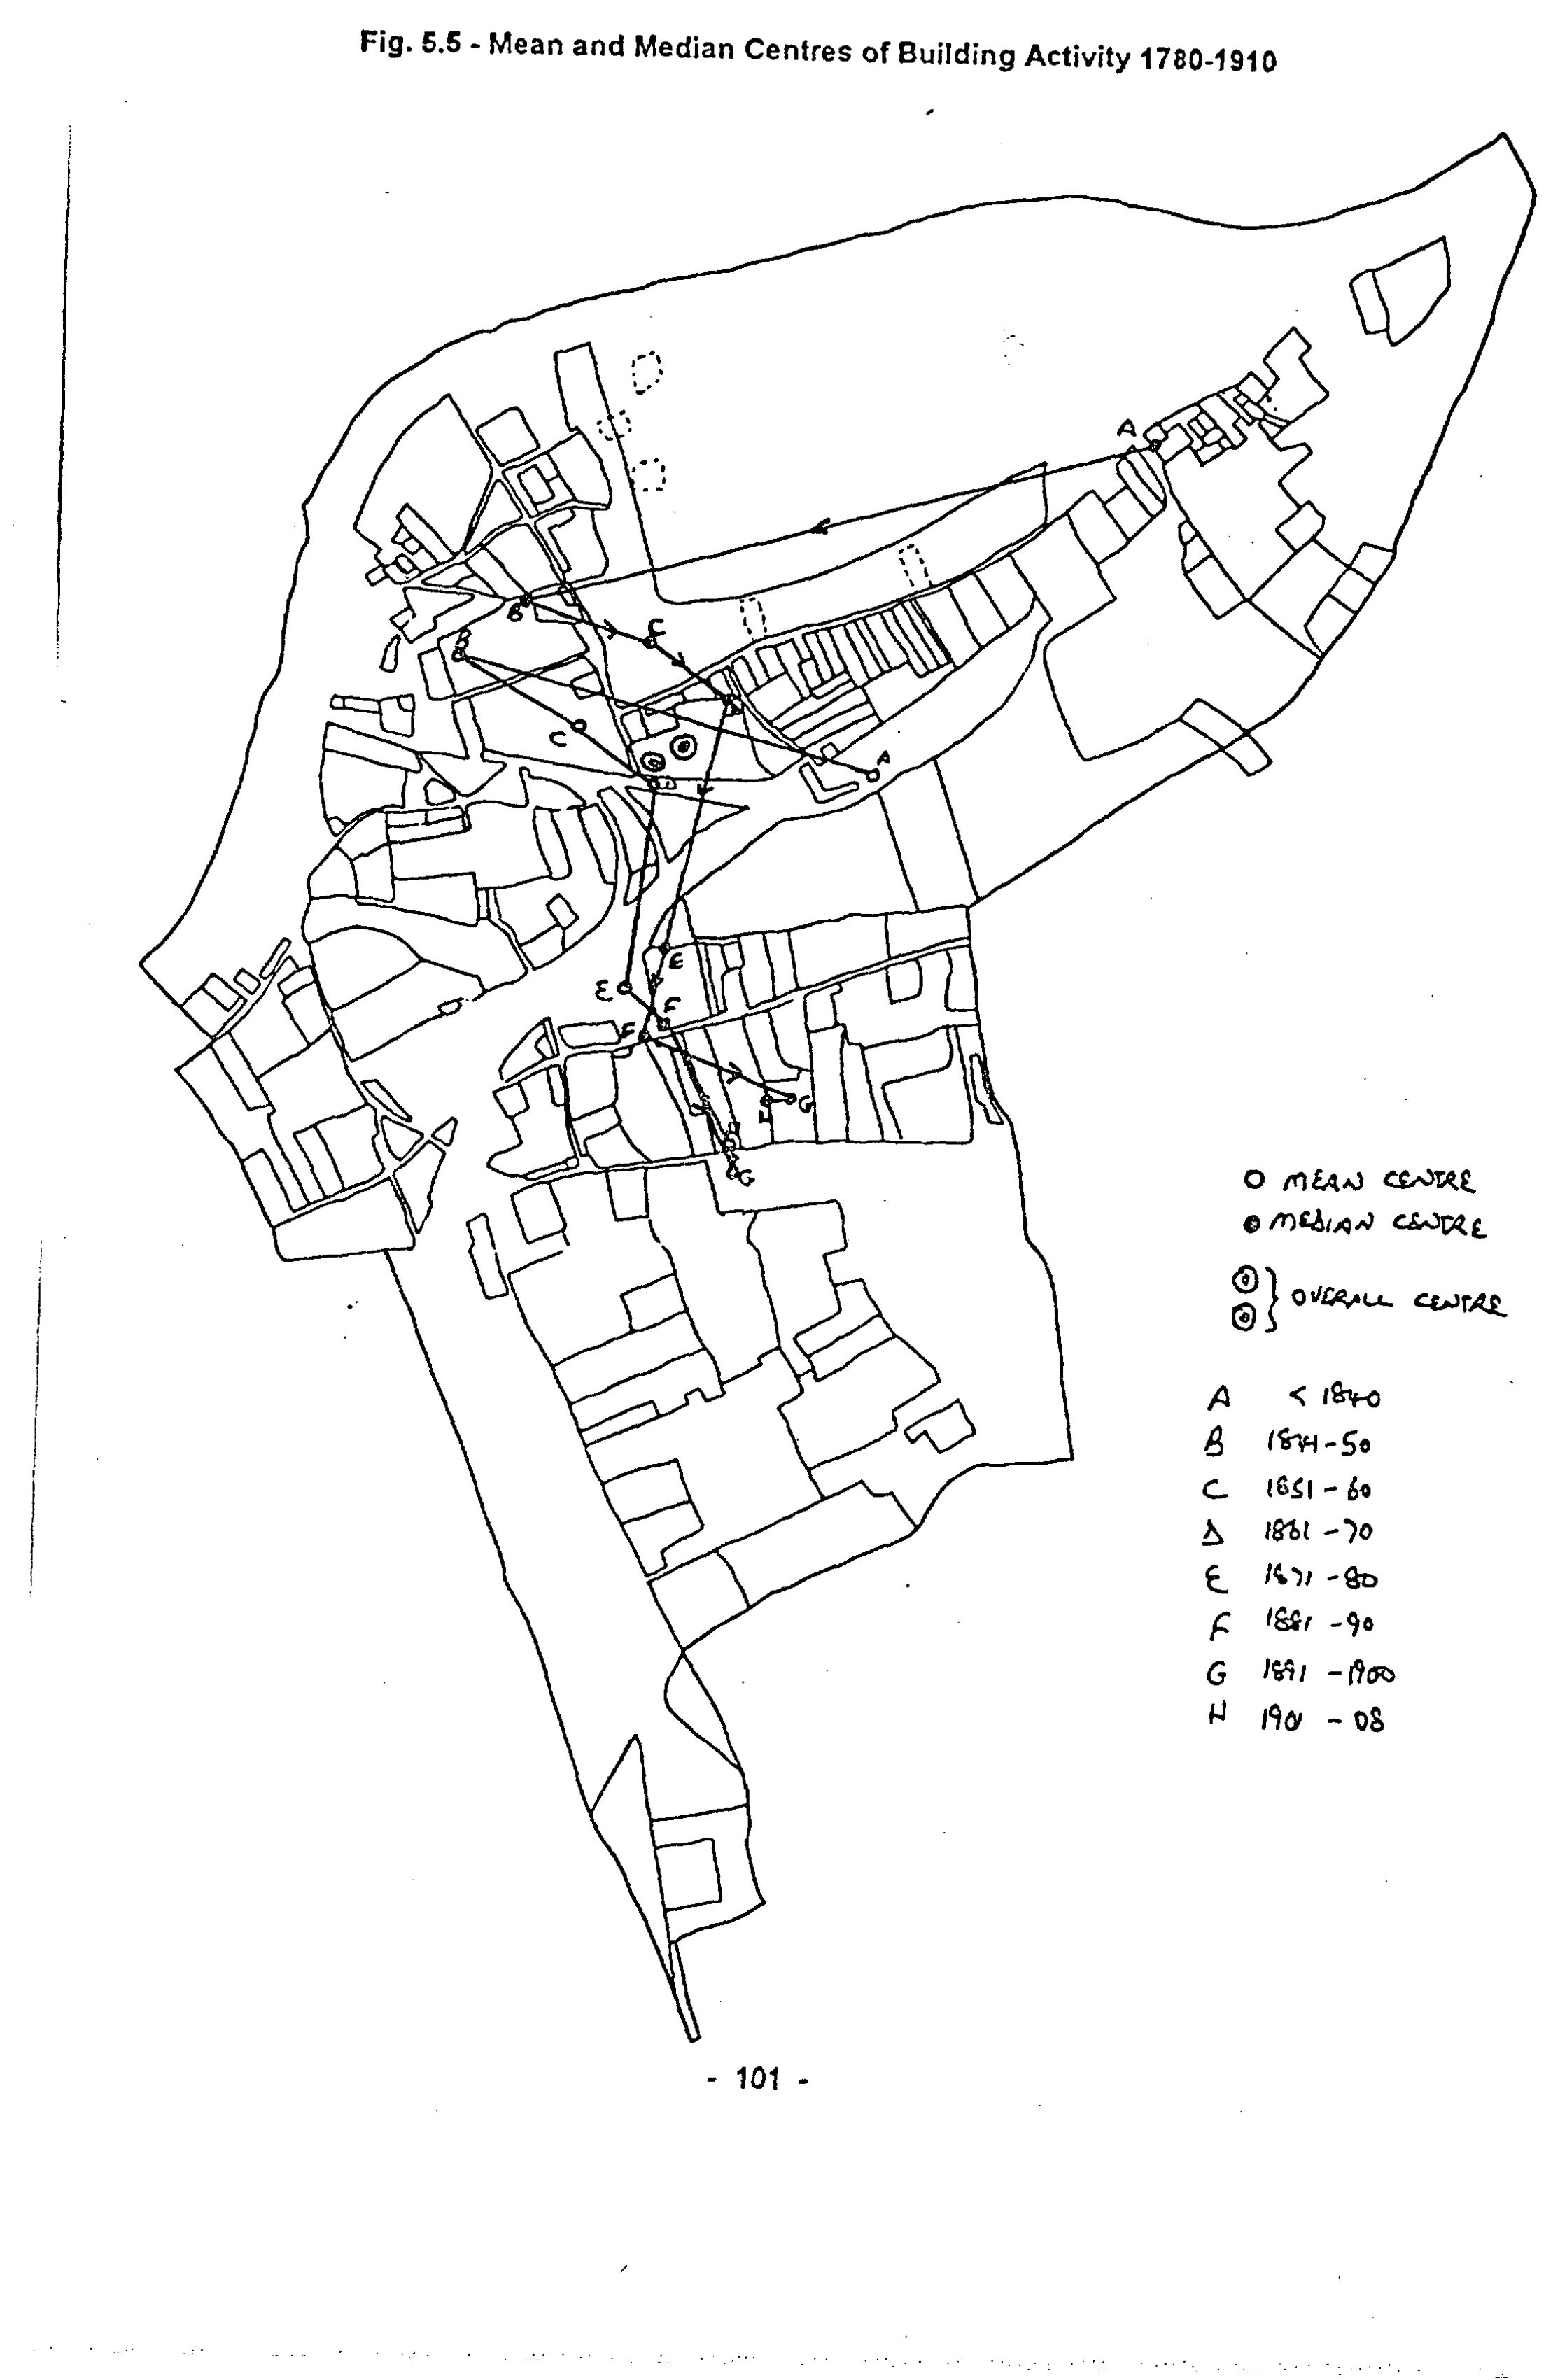
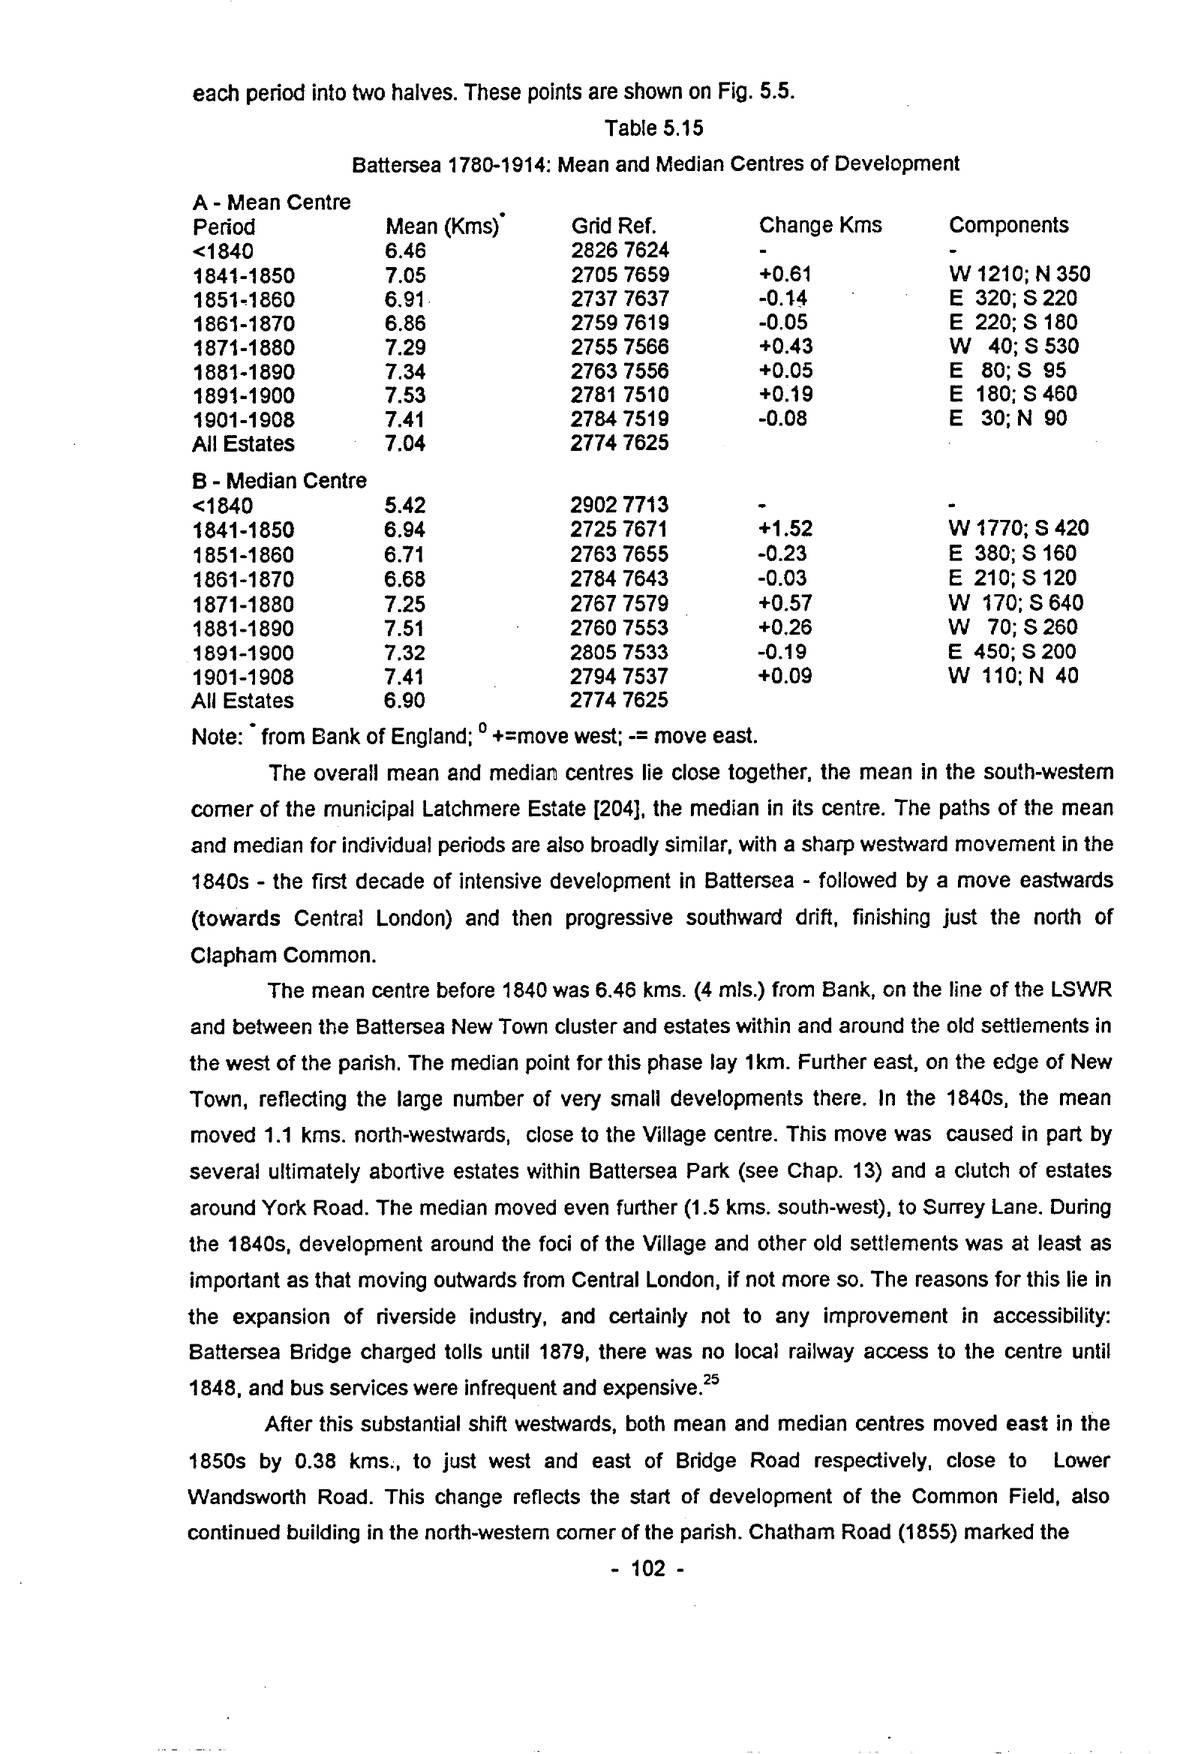
p. 102each period into two halves. These points are shown on Fig. 5.5.
| A – Mean Centre | ||||
|---|---|---|---|---|
| Period | Mean (Kms)∗ | Grid Ref. | Change Kms | Components |
| <1840 | 6.46 | 2826 7624 | - | - |
| 1841-1850 | 7.05 | 2705 7659 | +0.61 | W 1210; N 350 |
| 1851-1860 | 6.91 | 2737 7637 | -0.14 | E 320; S 220 |
| 1861-1870 | 6.86 | 2759 7619 | -0.05 | E 220; S 180 |
| 1871-1880 | 7.29 | 2755 7566 | +0.43 | W 40; S 530 |
| 1881-1890 | 7.34 | 2763 7556 | +0.05 | E 80; S 95 |
| 1891-1900 | 7.53 | 2781 7510 | +0.19 | E 180; S 460 |
| 1901-1908 | 7.41 | 2784 7519 | -0.08 | E 30; N 90 |
| All Estates | 7.04 | 2774 7625 | ||
| B – Median Centre | ||||
| <1840 | 5.42 | 2902 7713 | - | - |
| 1841-1850 | 6.94 | 2725 7671 | +1.52 | W 1770; S 420 |
| 1851-1860 | 6.71 | 2763 7655 | -0.23 | E 380; S 160 |
| 1861-1870 | 6.68 | 2784 7643 | -0.03 | E 210; S 120 |
| 1871-1880 | 7.25 | 2767 7579 | +0.57 | W 170; S 640 |
| 1881-1890 | 7.51 | 2760 7553 | +0.26 | W 70; S 260 |
| 1891-1900 | 7.32 | 2805 7533 | -0.19 | E 450; S 200 |
| 1901-1908 | 7.41 | 2794 7537 | +0.09 | W 110; N 40 |
| All Estates | 6.90 | 2774 7625 |
Note: ∗ from Bank of England; ° +=move west; -= move east.
The overall mean and median centres lie close together, the mean in the south-western corner of the municipal Latchmere Estate [204], the median in its centre. The paths of the mean and median for individual periods are also broadly similar, with a sharp westward movement in the 1840s – the first decade of intensive development in Battersea – followed by a move eastwards (towards Central London) and then progressive southward drift, finishing just the north of Clapham Common.
The mean centre before 1840 was 6.46 kms. (4 mls.) from Bank, on the line of the LSWR and between the Battersea New Town cluster and estates within and around the old settlements in the west of the parish. The median point for this phase lay 1km. Further east, on the edge of New Town, reflecting the large number of very small developments there. In the 1840s, the mean moved 1.1 kms. north-westwards, close to the Village centre. This move was caused in part by several ultimately abortive estates within Battersea Park (see Chap. 13) and a clutch of estates around York Road. The median moved even further (1.5 kms. south-west), to Surrey Lane. During the 1840s, development around the foci of the Village and other old settlements was at least as important as that moving outwards from Central London, if not more so. The reasons for this lie in the expansion of riverside industry, and certainly not to any improvement in accessibility: Battersea Bridge charged tolls until 1879, there was no local railway access to the centre until 1848, and bus services were infrequent and expensive.25
After this substantial shift westwards, both mean and median centres moved east in the 1850s by 0.38 kms., to just west and east of Bridge Road respectively, close to Lower Wandsworth Road. This change reflects the start of development of the Common Field, also continued building in the north-western corner of the parish. Chatham Road (1855) marked the
p. 103beginning of development in south Battersea. Apart from the villas on the Clapham Station estate [62], almost all building in the 1850s, generally a depressed period for building (see Section II), was working-class tenants, employed locally in new and expanded industries such as Price’s Candles in the west and the water and gasworks in the east, and also the transport and building sectors.
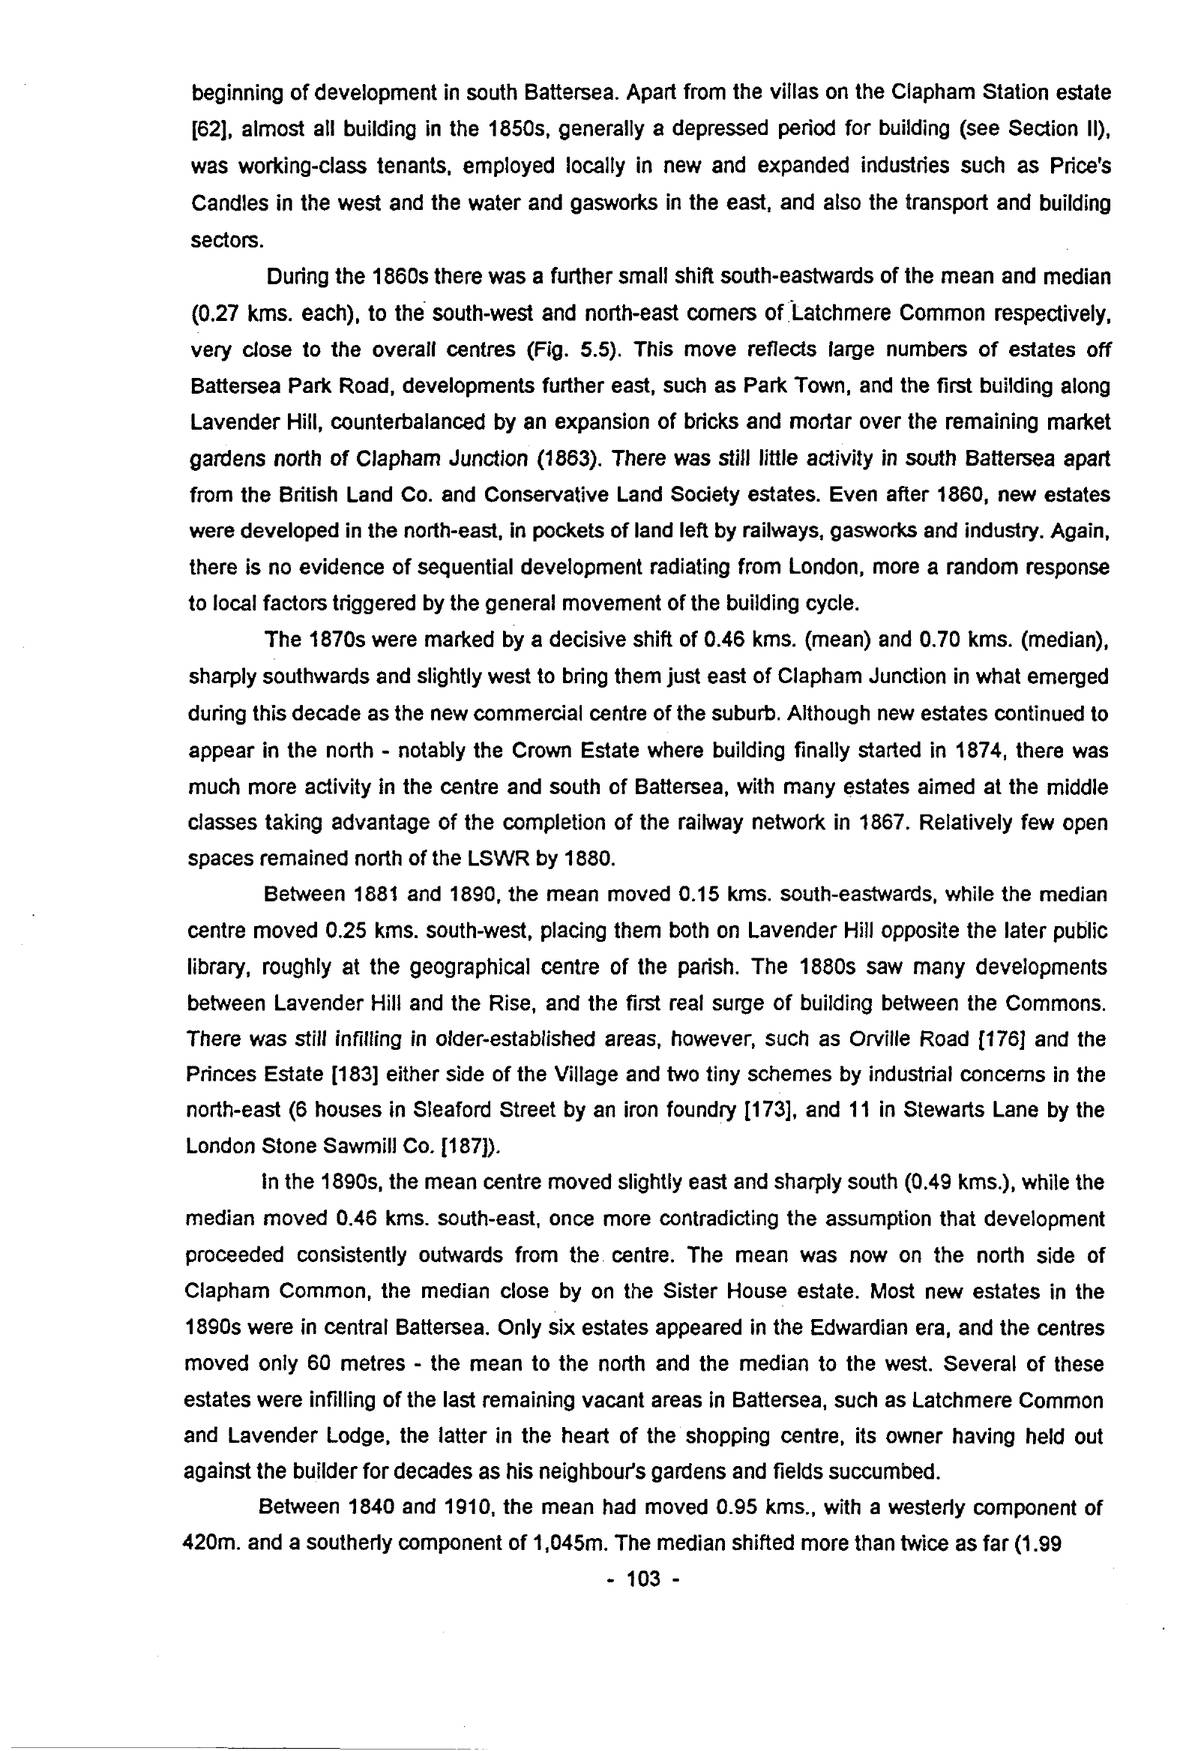
During the 1860s there was a further small shift south-eastwards of the mean and median (0.27 kms. each), to the south-west and north-east corners of Latchmere Common respectively, very close to the overall centres (Fig. 5.5). This move reflects large numbers of estates off Battersea Park Road, developments further east, such as Park Town, and the first building along Lavender Hill, counterbalanced by an expansion of bricks and mortar over the remaining market gardens north of Clapham Junction (1863). There was still little activity in south Battersea apart from the British Land Co. and Conservative Land Society estates. Even after 1860, new estates were developed in the north-east, in pockets of land left by railways, gasworks and industry. Again, there is no evidence of sequential development radiating from London, more a random response to local factors triggered by the general movement of the building cycle.
The 1870s were marked by a decisive shift of 0.46 kms. (mean) and 0.70 kms. (median), sharply southwards and slightly west to bring them just east of Clapham Junction in what emerged during this decade as the new commercial centre of the suburb. Although new estates continued to appear in the north – notably the Crown Estate where building finally started in 1874, there was much more activity in the centre and south of Battersea, with many estates aimed at the middle classes taking advantage of the completion of the railway network in 1867. Relatively few open spaces remained north of the LSWR by 1880.
Between 1881 and 1890, the mean moved 0.15 kms. south-eastwards, while the median centre moved 0.25 kms. south-west, placing them both on Lavender Hill opposite the later public library, roughly at the geographical centre of the parish. The 1880s saw many developments between Lavender Hill and the Rise, and the first real surge of building between the Commons. There was still infilling in older-established areas, however, such as Orville Road [176] and the Princes Estate [183] either side of the Village and two tiny schemes by industrial concerns in the north-east (6 houses in Sleaford Street by an iron foundry [173], and 11 in Stewarts Lane by the London Stone Sawmill Co. [187]).
In the 1890s, the mean centre moved slightly east and sharply south (0.49 kms.), while the median moved 0.46 kms. south-east, once more contradicting the assumption that development proceeded consistently outwards from the centre. The mean was now on the north side of Clapham Common, the median close by on the Sister House estate. Most new estates in the 1890s were in central Battersea. Only six estates appeared in the Edwardian era, and the centres moved only 60 metres – the mean to the north and the median to the west. Several of these estates were infilling of the last remaining vacant areas in Battersea, such as Latchmere Common and Lavender Lodge, the latter in the heart of the shopping centre, its owner having held out against the builder for decades as his neighbour’s gardens and fields succumbed.
Between 1840 and 1910, the mean had moved 0.95 kms., with a westerly component of 420m. and a southerly component of 1,045m. The median shifted more than twice as far (1.99
p. 104kms.) – 1,080m. west and 1,760m. south. Although the centre of building activity did therefore move away from Central London in a south-westerly direction, it did not do so systematically, and the influence of existing local settlement and industry seem to have been at least as significant until the 1870s, if not later.
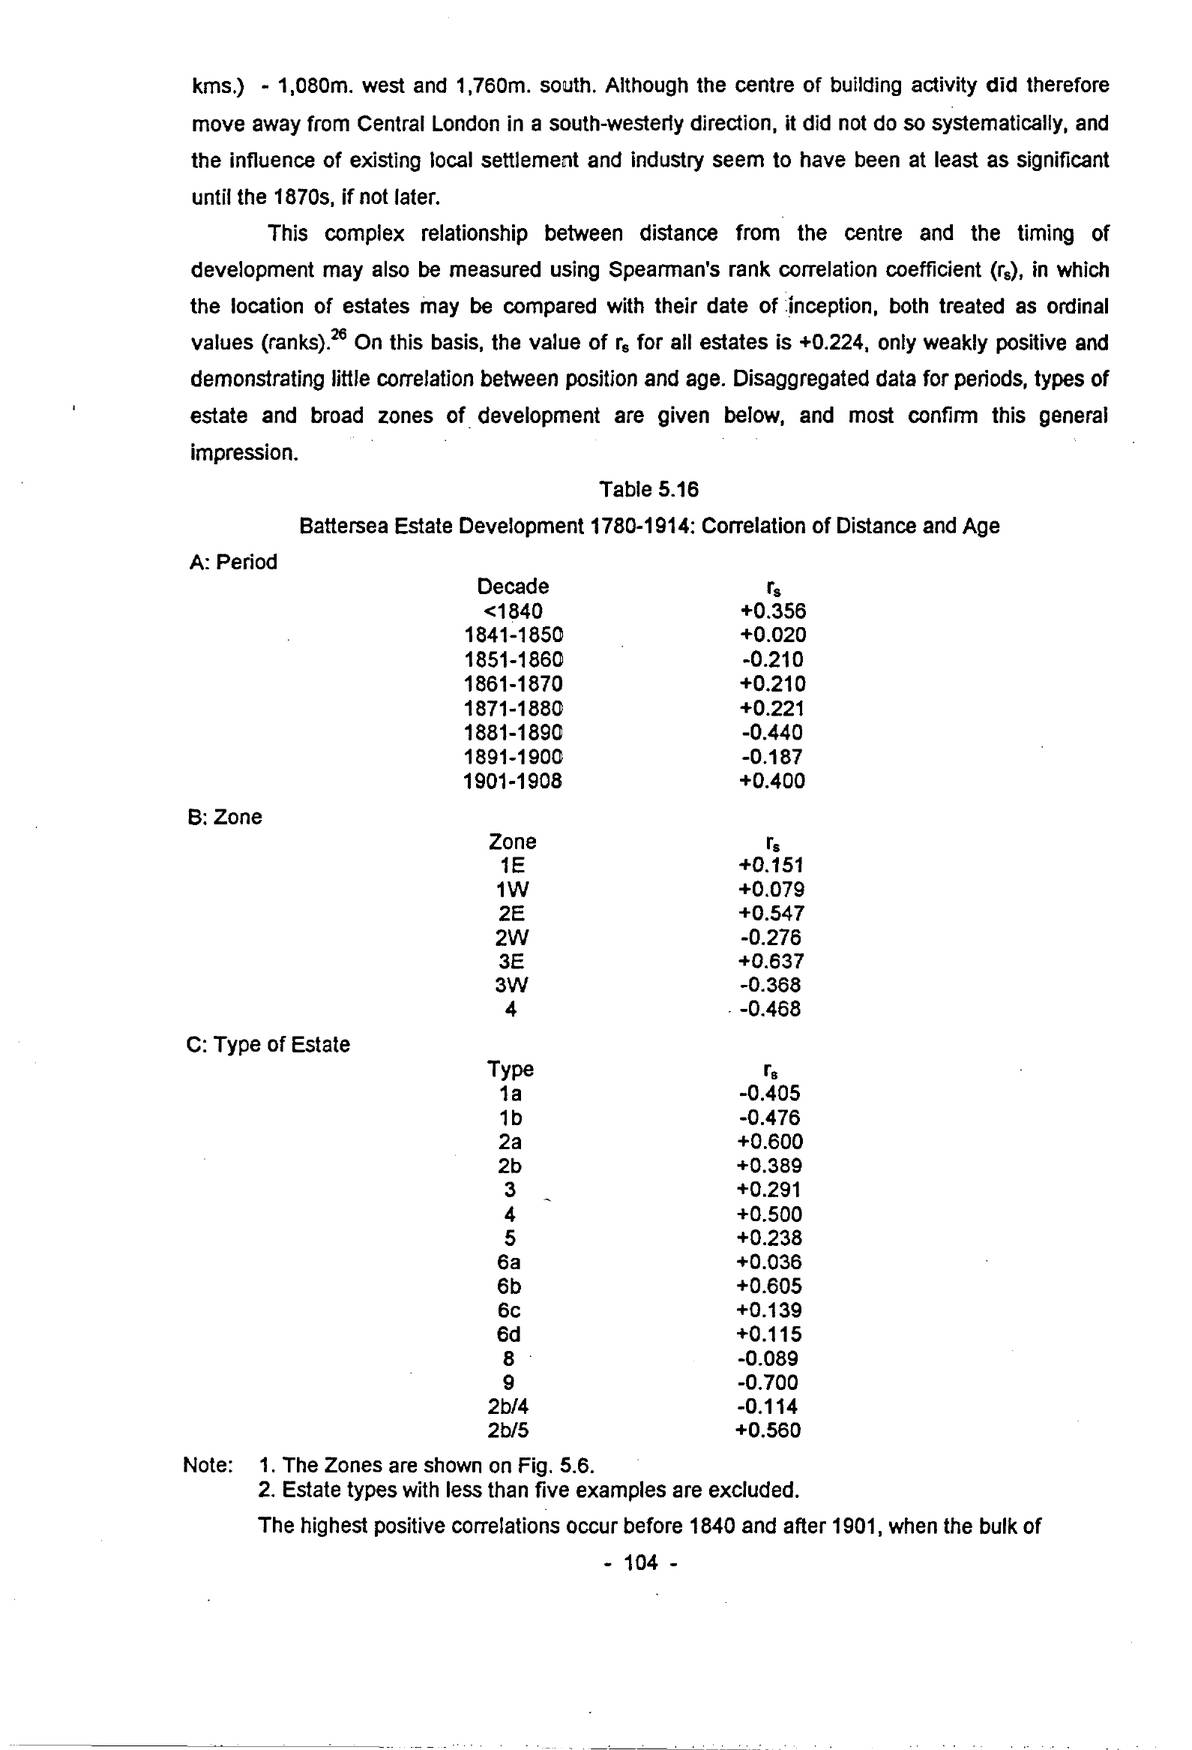
This complex relationship between distance from the centre and the timing of development may also be measured using Spearman’s rank correlation coefficient (rₛ), in which the location of estates may be compared with their date of inception, both treated as ordinal values (ranks).26 On this basis, the value of rₛ for all estates is +0.224, only weakly positive and demonstrating little correlation between position and age. Disaggregated data for periods, types of estate and broad zones of development are given below, and most confirm this general impression.
| A: Period | |
|---|---|
| Decade | rₛ |
| <1840 | +0.356 |
| 1841-1850 | +0.020 |
| 1851-1860 | -0.210 |
| 1861-1870 | +0.210 |
| 1871-1880 | +0.221 |
| 1881-1890 | -0.440 |
| 1891-1900 | -0.187 |
| 1901-1908 | +0.400 |
| B: Zone | |
| Zone | rₛ |
| 1E | +0.151 |
| 1W | +0.079 |
| 2E | +0.547 |
| 2W | -0.276 |
| 3E | +0.637 |
| 3W | -0.368 |
| 4 | -0.468 |
| C: Type of Estate | |
| Type | rₛ |
| 1a | -0.405 |
| 1b | -0.476 |
| 2a | +0.600 |
| 2b | +0.389 |
| 3 | +0.291 |
| 4 | +0.500 |
| 5 | +0.238 |
| 6a | +0.036 |
| 6b | +0.605 |
| 6c | +0.139 |
| 6d | +0.115 |
| 8 | -0.089 |
| 9 | -0.700 |
| 2b/4 | -0.114 |
| 2b/5 | +0.560 |
Note: 1. The Zones are shown on Fig. 5.6.
2. Estate types with less than five examples are excluded.
The highest positive correlations occur before 1840 and after 1901, when the bulk of
p. 105estates was located in north-east and south Battersea, closest to and furthest from central London, respectively. By 1900, the latter had the only significant areas of building land, apart from Latchmere Common, which was covered by council houses in 1903-4. Between 1851-60 there is a negative age:distance correlation, caused by the National Freehold Land Company selecting sites in the extreme west and south, well beyond any other building activity, at a time when the attention of most developers moved east from the Village to the Common Field. From 1880 to 1900 there was a similar contrast between increased activity in central Battersea, which would have been “expected” on the annular model of development, and estates not only in the east in areas otherwise long since built on (e.g. Mundella Road, 1881 [162]; Garfield Road, 1882 [168]), but even some close to the Village (e.g. Grove House, 1884 [176]; Princes Estate, 1888 [183]). The 1880s in fact show the strongest negative correlation between date and distance. Between 1861 and 1880, the correlations were weakly positive, with the building of new estates in east Battersea counteracted by continued development around Clapham Junction.
By grouping estates into zones, the level of “noise” inherent in smaller areas is reduced and correlations are correspondingly stronger. Zone 1 (47 estates (22%) – 14 East/33 West) shows the weakest relationship. It includes the industrial riverside, Battersea Park and the Village, and new building was as likely at the very beginning (e.g. Ford’s Buildings of 1780 [1] and Isaac Pennington’s 1805 estate [8] in the far north-west) as at the end of the era (e.g. Princes [183] and Winstead Street [202]). The dynamics of this zone seem to be related to local factors above all. There is some evidence that the area acquired for Battersea Park (1846-53) would have been covered by estates of the usual pattern had the Government not intervened (see Chap. 3). The very low correlation between Zone 1W and distance from the centre shows that the original settlements acted as centres of growth in their own right.
Zone 2 (79 estates (38%) – 55 East, 24 West) includes myriad small estates at New Town and south of Battersea Park Road, as well as larger blocks of market garden ground north of Clapham Junction. In the east, the correlation between date and distance from the centre is distinctly positive (+0.547). Building began in the 1780s in New Town, largely missed the 1840s, and progressively colonised the strips of the Common Field between 1851 and 1870. This pattern is reversed in Zone 2W, as development oscillated across the area, starting in 1839 with the Carters in the far west and finishing in the centre with Falcon Park [153] and Kambala Road [171].
Zone 3 (60 estates (28%) – 32 East, 28 West) demonstrates this east:west dichotomy even more strongly. In 3E, the correlation is +0.637. Estates begun before 1870 lay in the north-east, or along Lavender Hill from east to west. This trend continued from 1870 to 1900 as Central Battersea filled up, with few of the reversals caused by infilling observable in other zones. In 3W, however, the age-distance correlation is negative, reflecting early building in the Rise-Falcon Lane area, even though most land around the new shopping centre was undeveloped before 1880.
Zone 4 (23 estates (11%)) has an even stronger negative correlation (-0.468), with some of its earliest estates (Chatham Road [64]; Nottingham Road [91], and Old Park [102]) remote from any contemporary activity. The first two were land company estates, whose concern was more with the acquisition of cheap land to be subdivided into small plots for sale to freeholders, although building did commence shortly after laying out in both cases.
p. 106Estate types also exhibit wide-ranging correlations with distance from the centre. The most negative relationship is that of the dwellings companies, some of whom acquired land left behind by earlier waves of building, for example the Artisans’ & General Labourers’ Co. at Garfield Road [168]. Original landowners, both resident and absentee, also show negative correlations, in this case reflecting their small scale, often infilling or accretion around existing settlements. This is also true of manufacturers (Type 6a), few of them locally based, and of market gardeners and nurserymen, who clearly responded to local, rather than metropolitan pressures. In contrast, secondary landowners show positive correlations (resident +0.600; absentee +0.389), indicating that they sought out building land for other than local considerations, although it seems that absentees were less good at judging these matters. Architects/surveyors and lawyers often failed to fit the “annular model” when setting out estates, whereas builders displayed a more positive correlation (+0.500). Those engaged in commerce achieved the a correlation of +0.605. Among the joint-developer groups, absentee owners/builders, concentrated in Zones 3 and 4, had a slightly negative correlation, whereas absentee owners/lawyers had a strongly positive relationship. The Corsellis family seem to have had a deliberate policy for sequential development of land in central Battersea from 1885 to 1895.
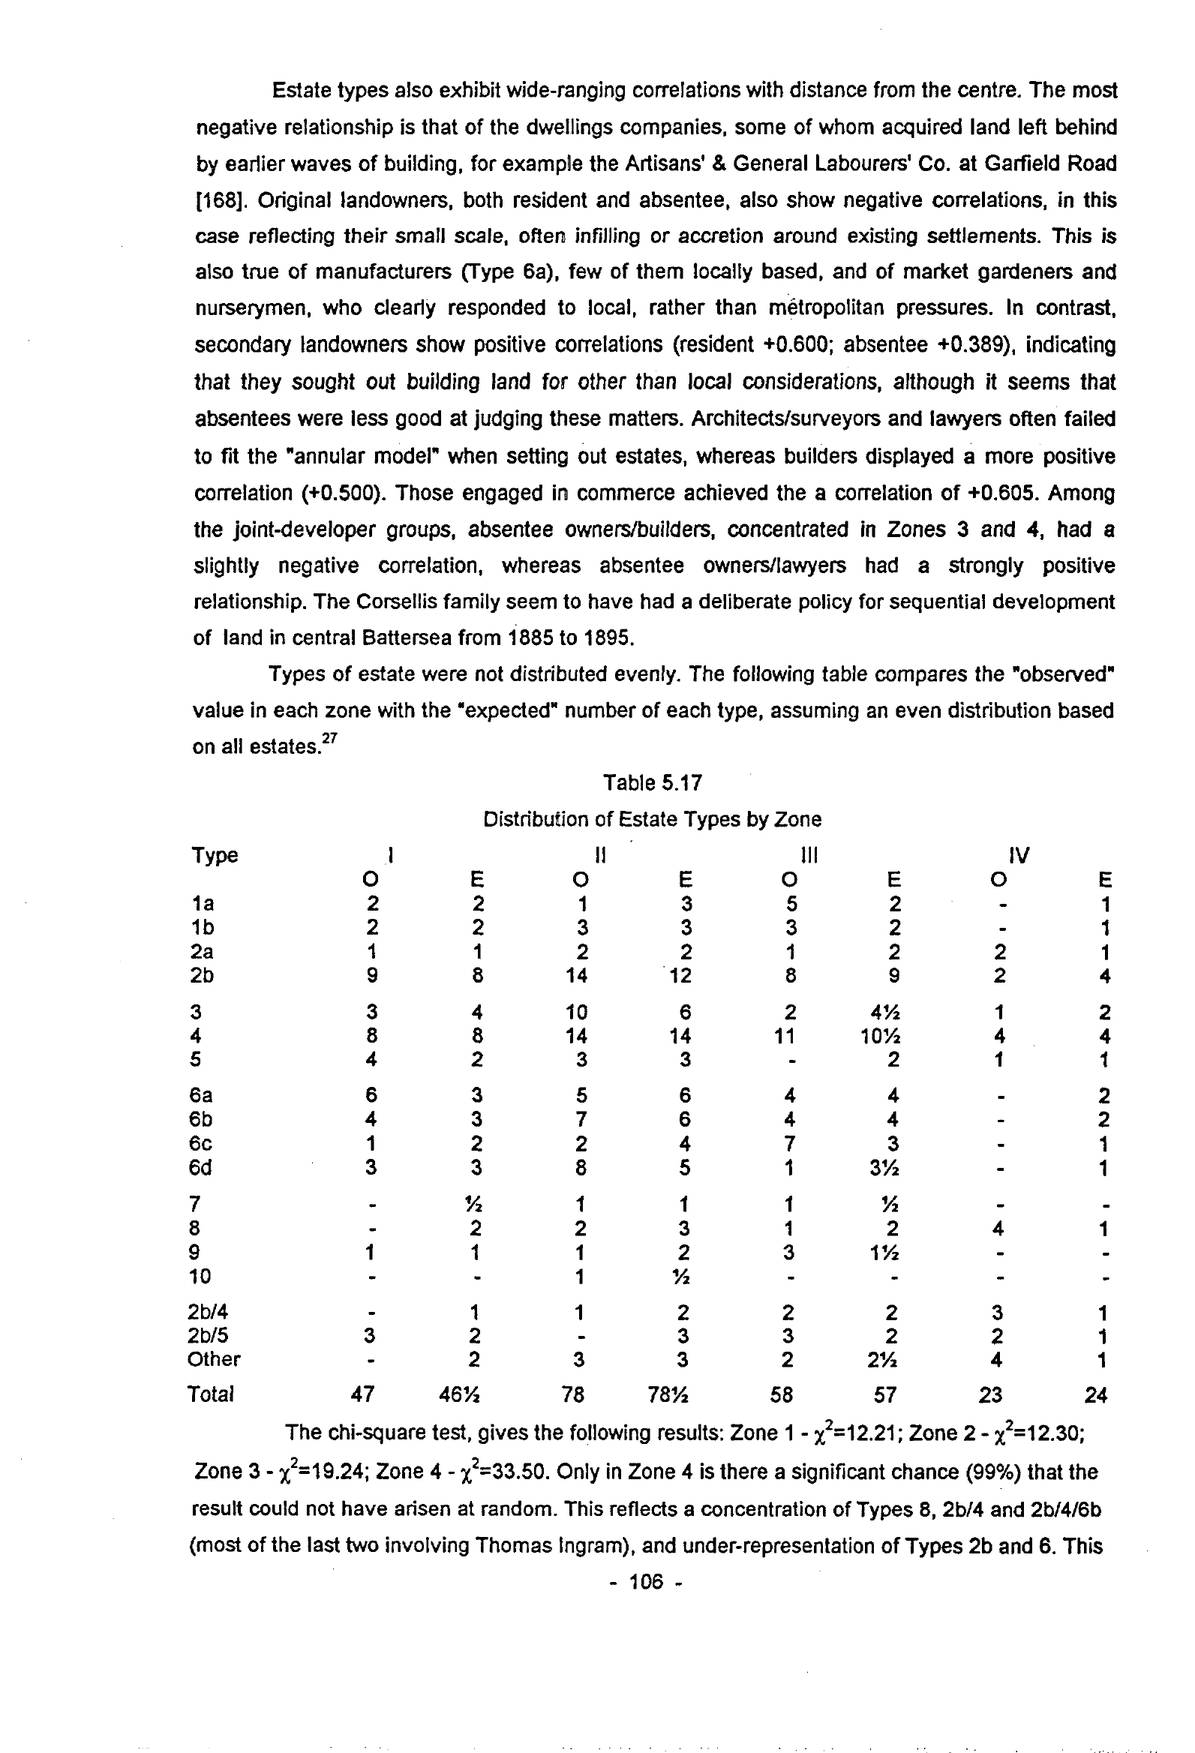
Types of estate were not distributed evenly. The following table compares the “observed” value in each zone with the “expected” number of each type, assuming an even distribution based on all estates.27
| Type | I | II | III | IV | ||||
|---|---|---|---|---|---|---|---|---|
| O | E | O | E | O | E | O | E | |
| 1a | 2 | 2 | 1 | 3 | 5 | 2 | - | 1 |
| 1b | 2 | 2 | 3 | 3 | 3 | 2 | - | 1 |
| 2a | 1 | 1 | 2 | 2 | 1 | 2 | 2 | 1 |
| 2b | 9 | 8 | 14 | 12 | 8 | 9 | 2 | 4 |
| 3 | 3 | 4 | 10 | 6 | 2 | 4½ | 1 | 2 |
| 4 | 8 | 8 | 14 | 14 | 11 | 10½ | 4 | 4 |
| 5 | 4 | 2 | 3 | 3 | - | 2 | 1 | 1 |
| 6a | 6 | 3 | 5 | 6 | 4 | 4 | - | 2 |
| 6b | 4 | 3 | 7 | 6 | 4 | 4 | - | 2 |
| 6c | 1 | 2 | 2 | 4 | 7 | 3 | - | 1 |
| 6d | 3 | 3 | 8 | 5 | 1 | 3½ | - | 1 |
| 7 | - | ½ | 1 | 1 | 1 | ½ | - | - |
| 8 | - | 2 | 2 | 3 | 1 | 2 | 4 | 1 |
| 9 | 1 | 1 | 1 | 2 | 3 | 1½ | - | - |
| 10 | - | - | 1 | ½ | - | - | - | - |
| 2b/4 | - | 1 | 1 | 2 | 2 | 2 | 3 | 1 |
| 2b/5 | 3 | 2 | - | 3 | 3 | 2 | 2 | 1 |
| Other | - | 2 | 3 | 3 | 2 | 2½ | 4 | 1 |
| Total | 47 | 46½ | 78 | 78½ | 58 | 57 | 23 | 24 |
The chi-square test, gives the following results: Zone 1 – χ²=12.21; Zone 2 – χ²=12.30; Zone 3 – χ²=19.24; Zone 4 – χ²=33.50. Only in Zone 4 is there a significant chance (99%) that the result could not have arisen at random. This reflects a concentration of Types 8, 2b/4 and 2b/4/6b (most of the last two involving Thomas Ingram), and under-representation of Types 2b and 6. This
p. 107is partly a function of the chronology of the various types. Hardly any development had occurred in Zone 4 before 1860, and large-scale building postdates 1880. In the remaining Zones, there is a more than 10% chance that the results could be random.
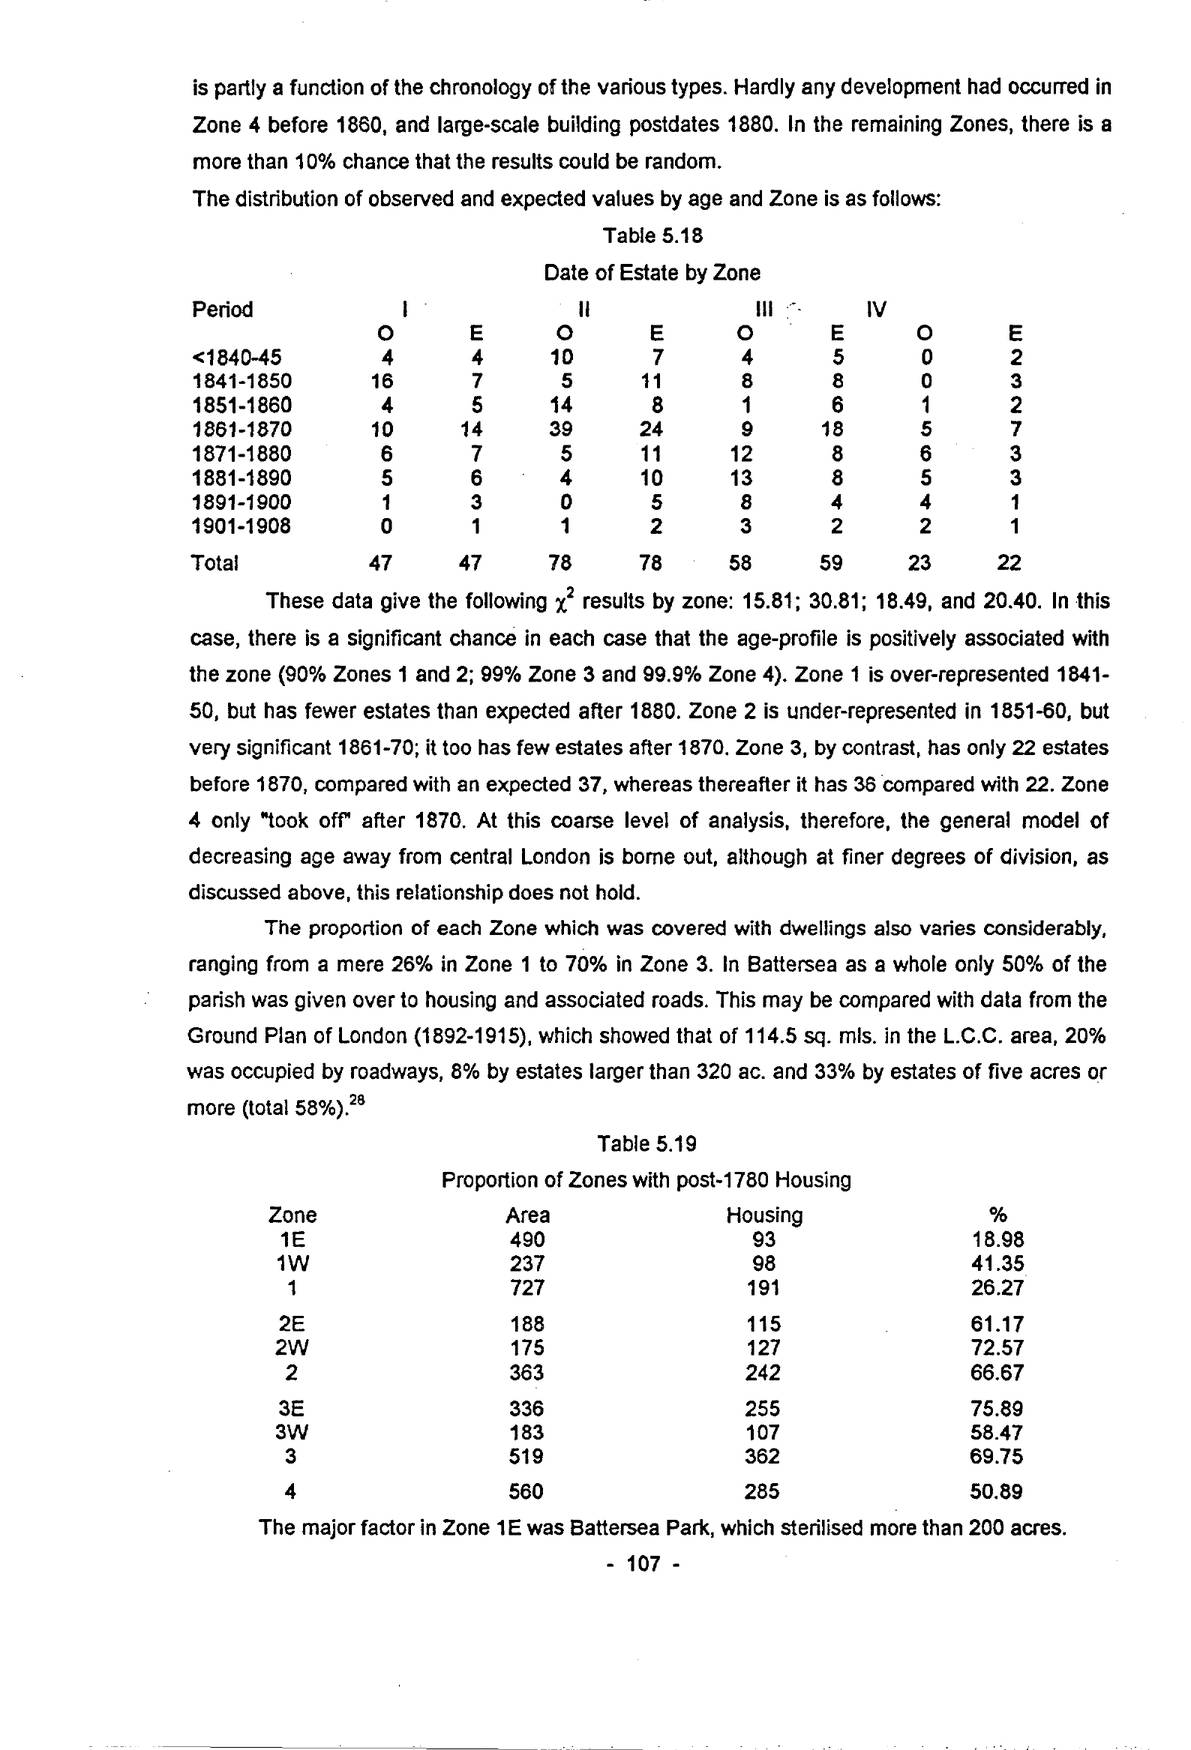
The distribution of observed and expected values by age and Zone is as follows:
| Period | I | II | III | IV | ||||
|---|---|---|---|---|---|---|---|---|
| O | E | O | E | O | E | O | E | |
| <1840-45 | 4 | 4 | 10 | 7 | 4 | 5 | 0 | 2 |
| 1841-1850 | 16 | 7 | 5 | 11 | 8 | 8 | 0 | 3 |
| 1851-1860 | 4 | 5 | 14 | 8 | 1 | 6 | 1 | 2 |
| 1861-1870 | 10 | 14 | 39 | 24 | 9 | 18 | 5 | 7 |
| 1871-1880 | 6 | 7 | 5 | 11 | 12 | 8 | 6 | 3 |
| 1881-1890 | 5 | 6 | 4 | 10 | 13 | 8 | 5 | 3 |
| 1891-1900 | 1 | 3 | 0 | 5 | 8 | 4 | 4 | 1 |
| 1901-1908 | 0 | 1 | 1 | 2 | 3 | 2 | 2 | 1 |
| Total | 47 | 47 | 78 | 78 | 58 | 59 | 23 | 22 |
These data give the following χ² results by zone: 15.81; 30.81; 18.49, and 20.40. In this case, there is a significant chance in each case that the age-profile is positively associated with the zone (90% Zones 1 and 2; 99% Zone 3 and 99.9% Zone 4). Zone 1 is over-represented 1841-50, but has fewer estates than expected after 1880. Zone 2 is under-represented in 1851-60, but very significant 1861-70; it too has few estates after 1870. Zone 3, by contrast, has only 22 estates before 1870, compared with an expected 37, whereas thereafter it has 36 compared with 22. Zone 4 only “took off” after 1870. At this coarse level of analysis, therefore, the general model of decreasing age away from central London is borne out, although at finer degrees of division, as discussed above, this relationship does not hold.
The proportion of each Zone which was covered with dwellings also varies considerably, ranging from a mere 26% in Zone 1 to 70% in Zone 3. In Battersea as a whole only 50% of the parish was given over to housing and associated roads. This may be compared with data from the Ground Plan of London (1892-1915), which showed that of 114.5 sq. mls. in the L.C.C. area, 20% was occupied by roadways, 8% by estates larger than 320 ac. and 33% by estates of five acres or more (total 58%).28
| Zone | Area | Housing | % |
|---|---|---|---|
| 1E | 490 | 93 | 18.98 |
| 1W | 237 | 98 | 41.35 |
| 1 | 727 | 191 | 26.27 |
| 2E | 188 | 115 | 61.17 |
| 2W | 175 | 127 | 72.57 |
| 2 | 363 | 242 | 66.67 |
| 3E | 336 | 255 | 75.89 |
| 3W | 183 | 107 | 58.47 |
| 3 | 519 | 362 | 69.75 |
| 4 | 560 | 285 | 50.89 |
The major factor in Zone 1E was Battersea Park, which sterilised more than 200 acres.
p. 108There is every indication that this land would have been covered by housing after 1840, increasing the proportion with housing to 65-70%. East of Chelsea Bridge Road, virtually all of this sub-zone was given over to railways, waterworks and industry. Zone 1W contained most of the housing extant in 1780 (c.70 acres), as well as a substantial amount of industry.
Zone 2 contained little pre-urban housing. Even so, only two-thirds was taken up by new developments, with the western half more densely occupied than the east. Despite including Nine Elms and Longhedge works and numerous other railway activities, Zone 3E was the most highly-developed. It included the very large Park Town and Shaftesbury estates, and a solid residential block between Heathwall and Clapham Common, with only scattered schools and churches to relieve the serried ranks of terraces put up between 1865 and 1900. By contrast, Zone 3W contains both Clapham Junction and the commercial centre, and only three-fifths of the land was used for housing. There was a mixture of substantial villas and terraces more typical of northern Kensington than Battersea, four-roomed brick boxes of the 1850s and 1860s and their more ornate successors of the 1880s. Much of Zone 4 was of course taken up by the Commons, leaving only half for building. Apart from the mansions round Clapham Common, there was virtually no building before 1860, and most estates date from the period 1880-1914. Many of the first generation houses survive, albeit stripped of their grounds.28