p. 25This chapter has three aims: (1) to describe the geological and topographical background of Battersea, setting the stage for the vast transformation which began in 1790; (2) to sketch eighteenth-century Battersea, the end of an essentially agricultural parish, albeit one with an unusually large amount of industry; and (3) to analyse the Tithe Map and Apportionment of 1839 and the Spencer land sales of 1835-6, which form a datum just before the onset of the first main phase of building.
I: Geology and Topography
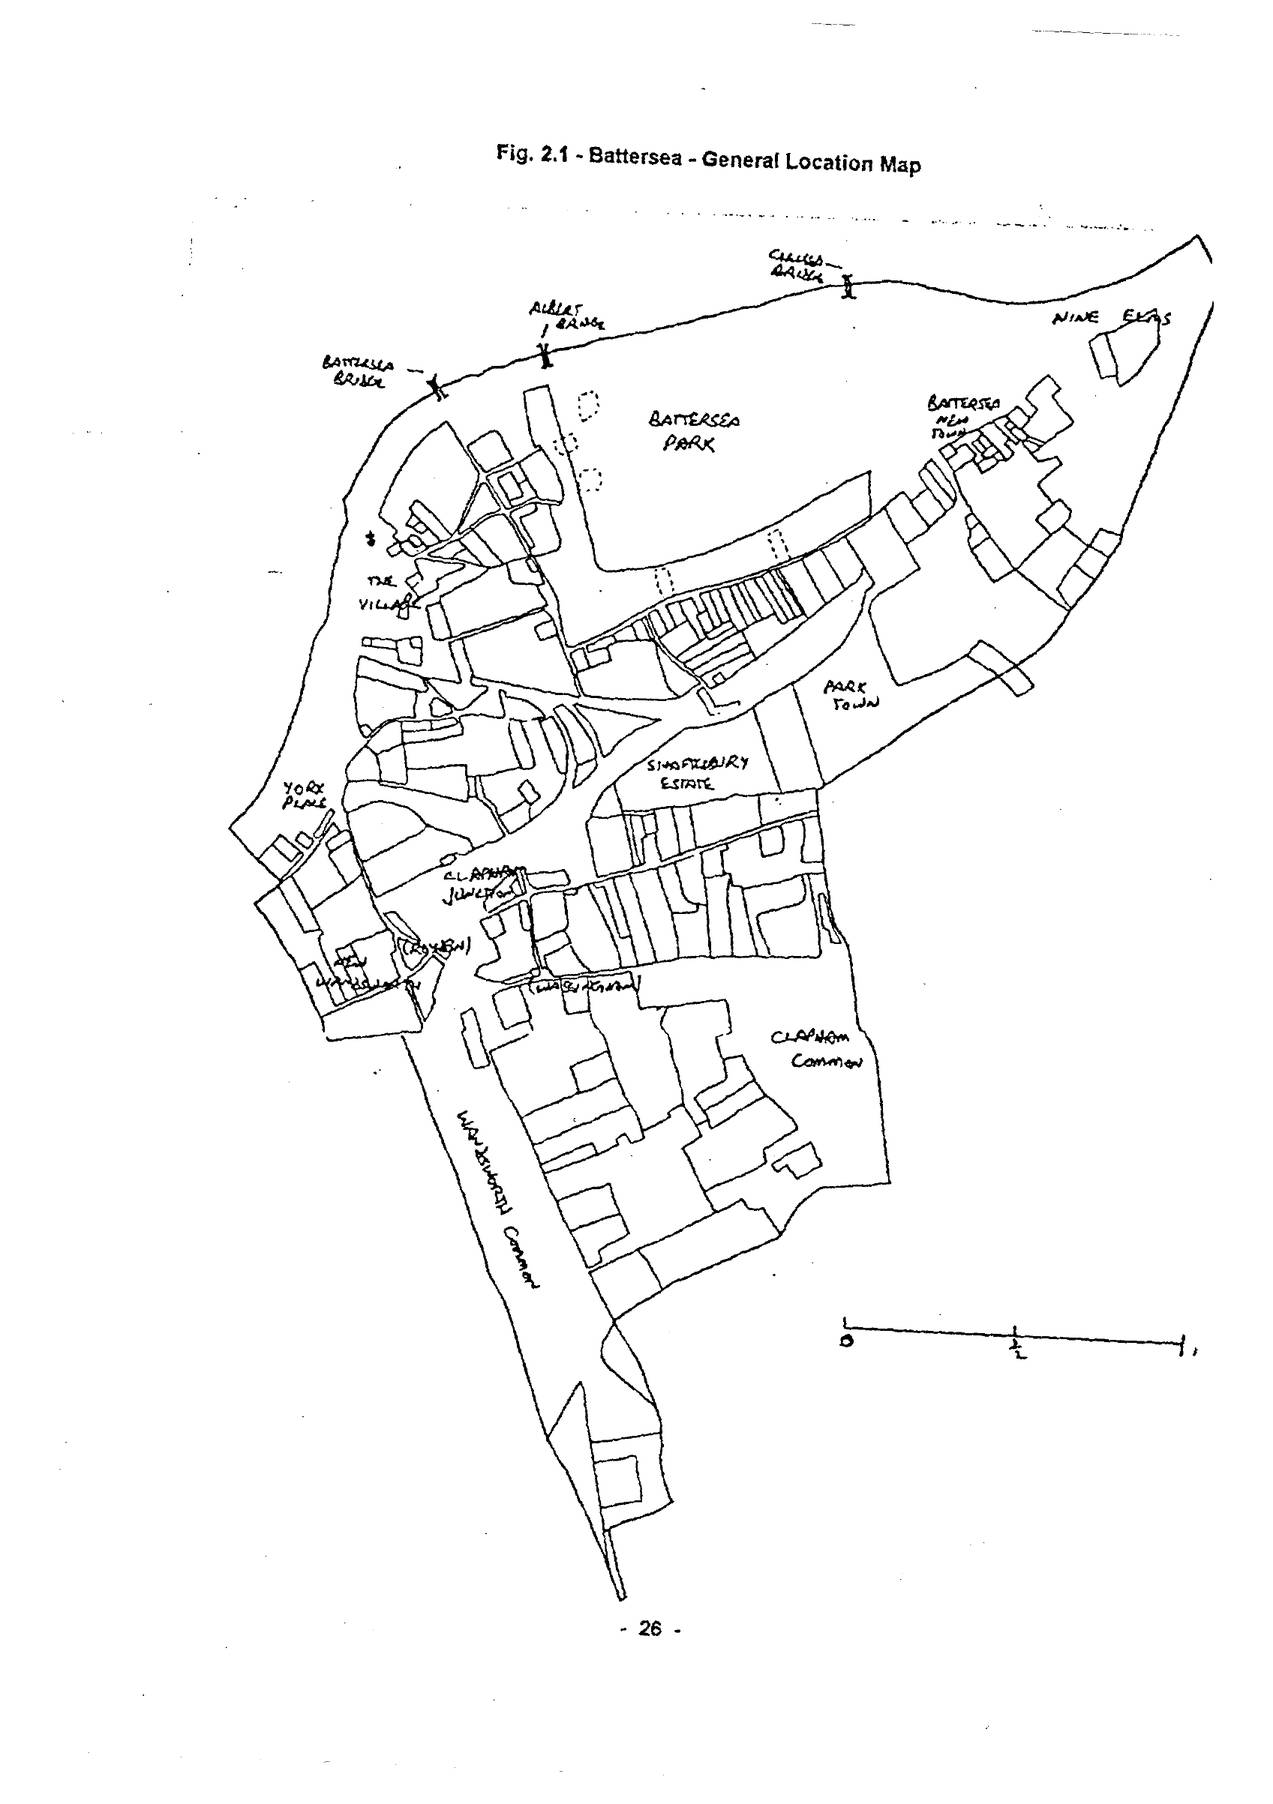
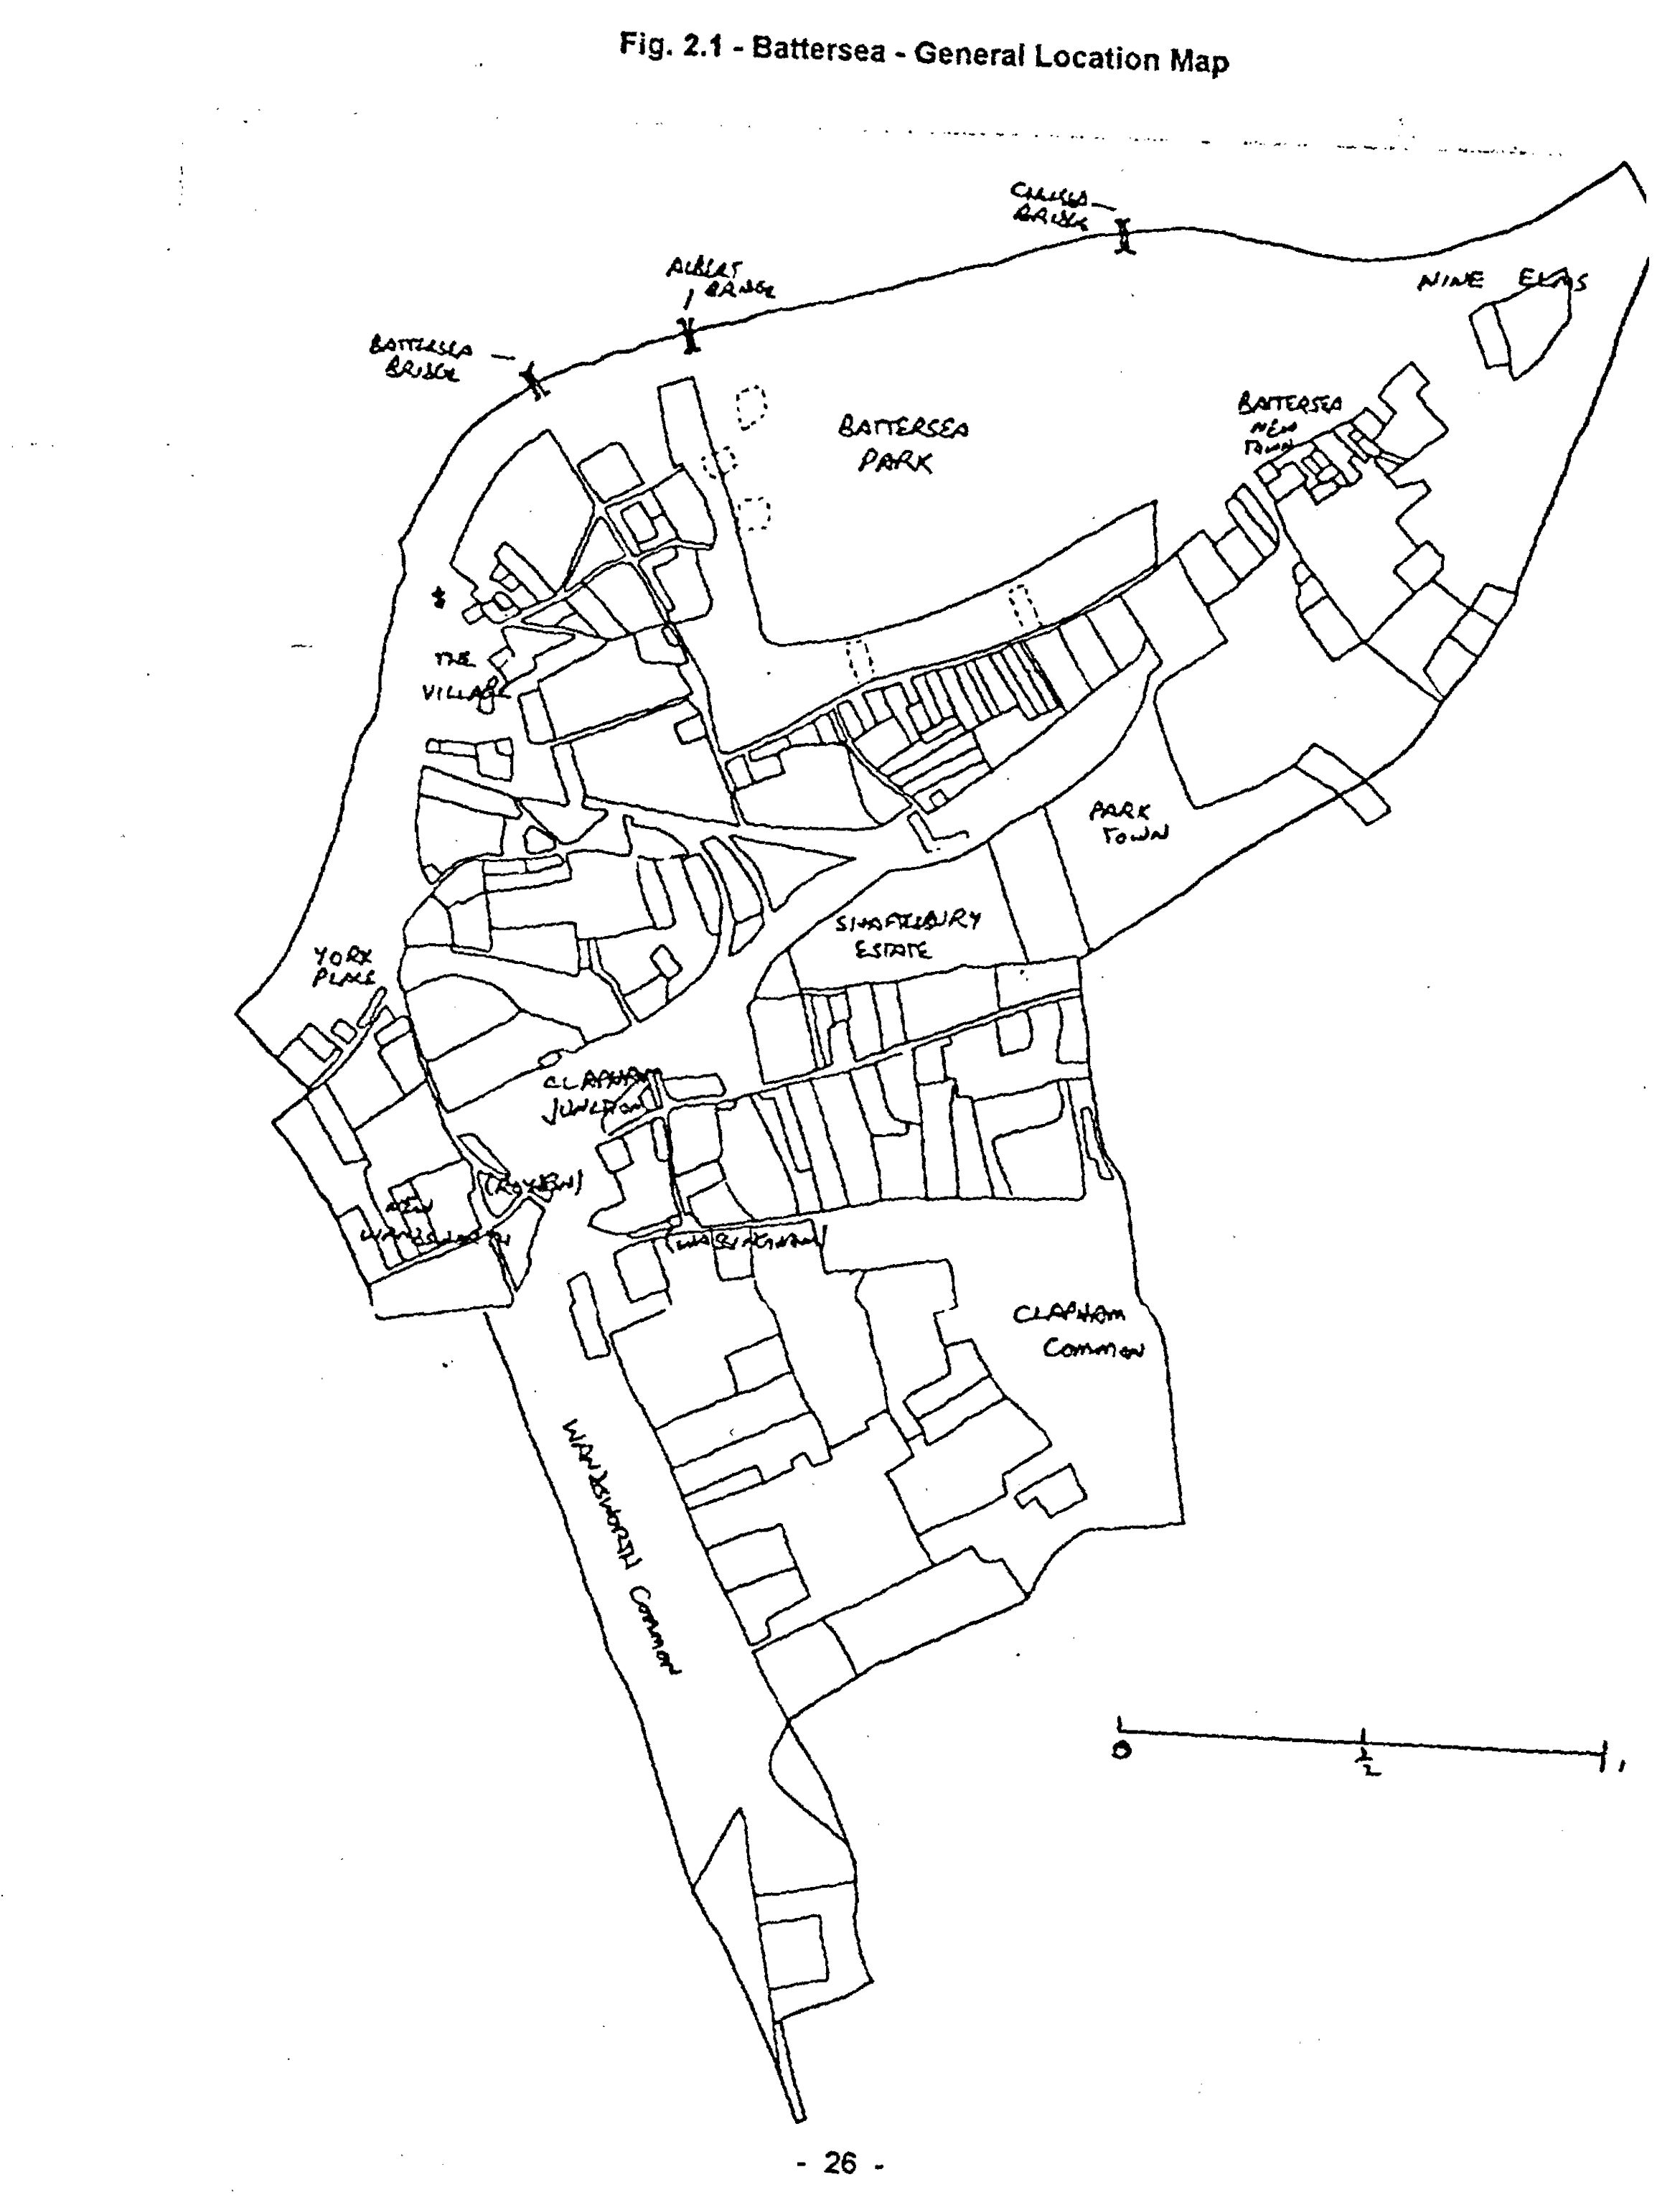
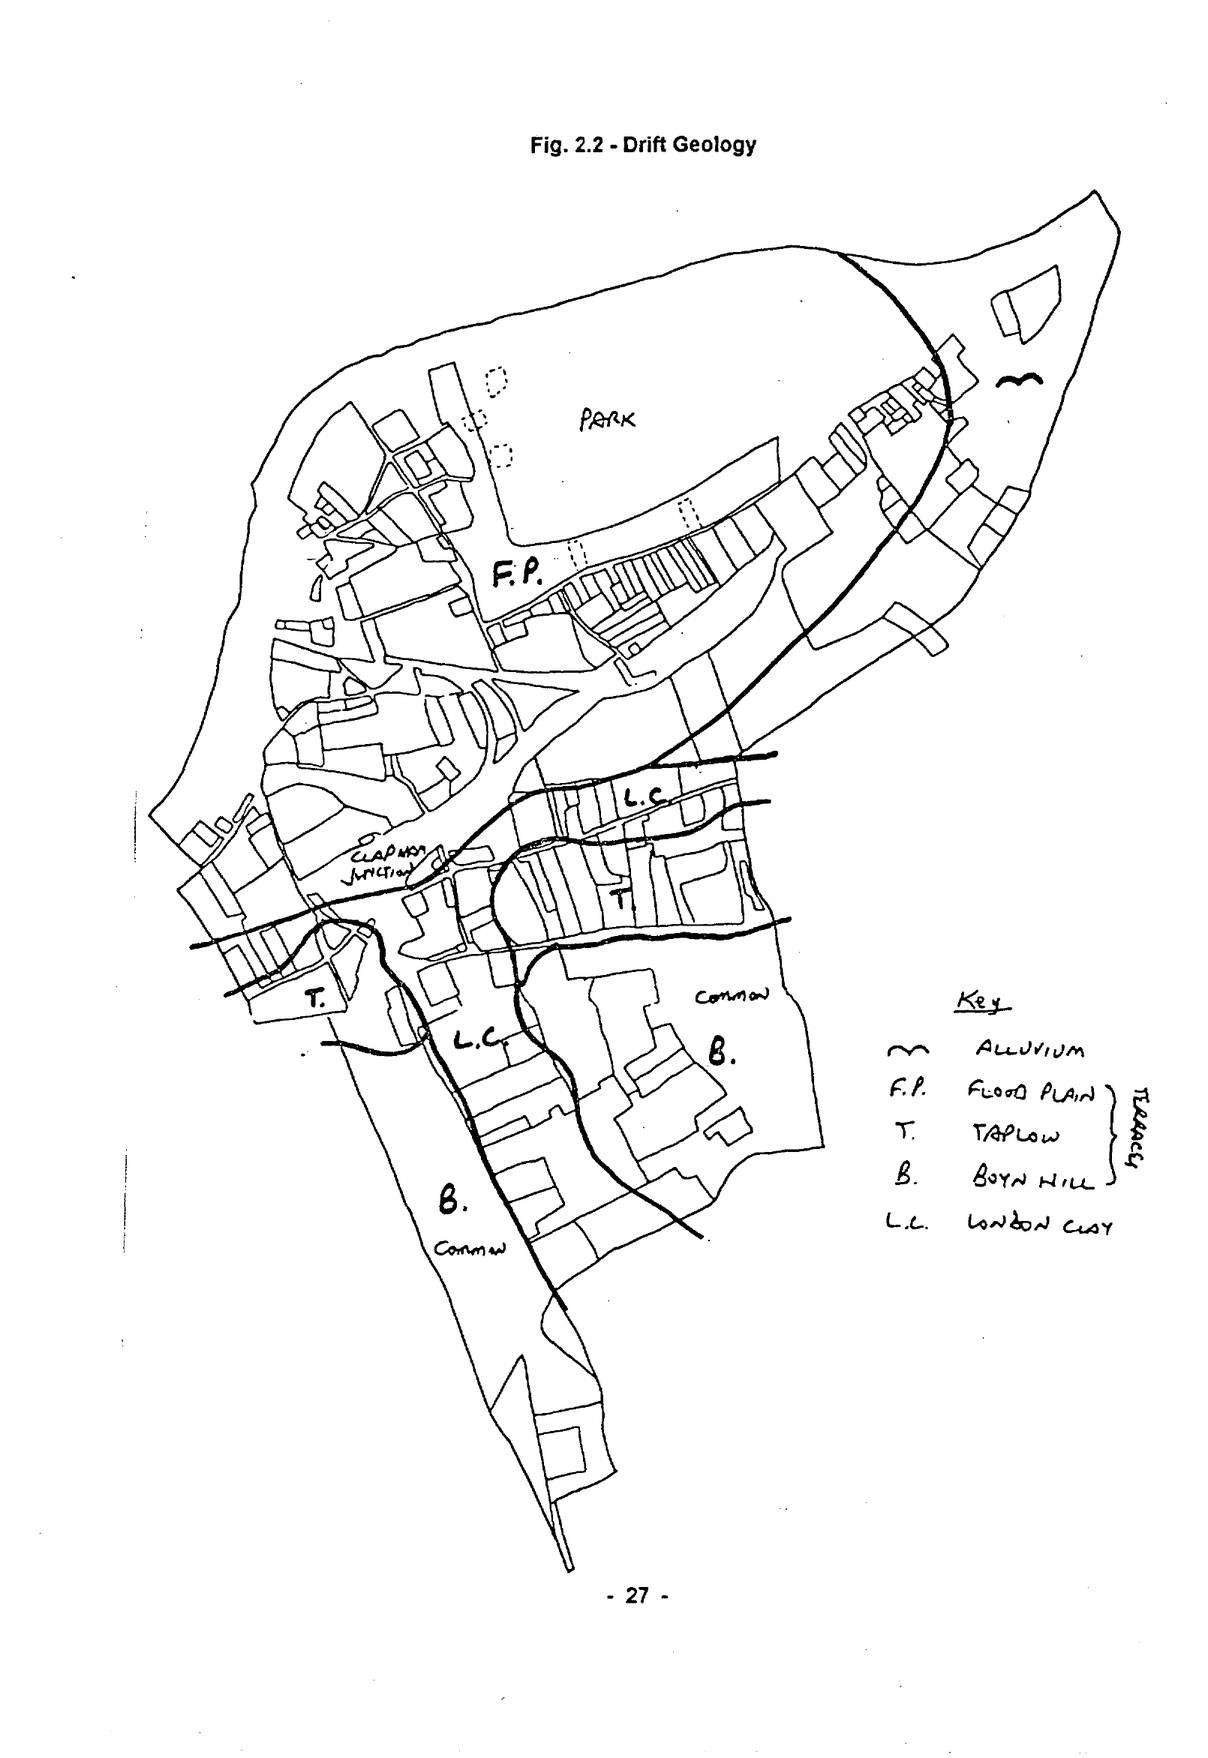
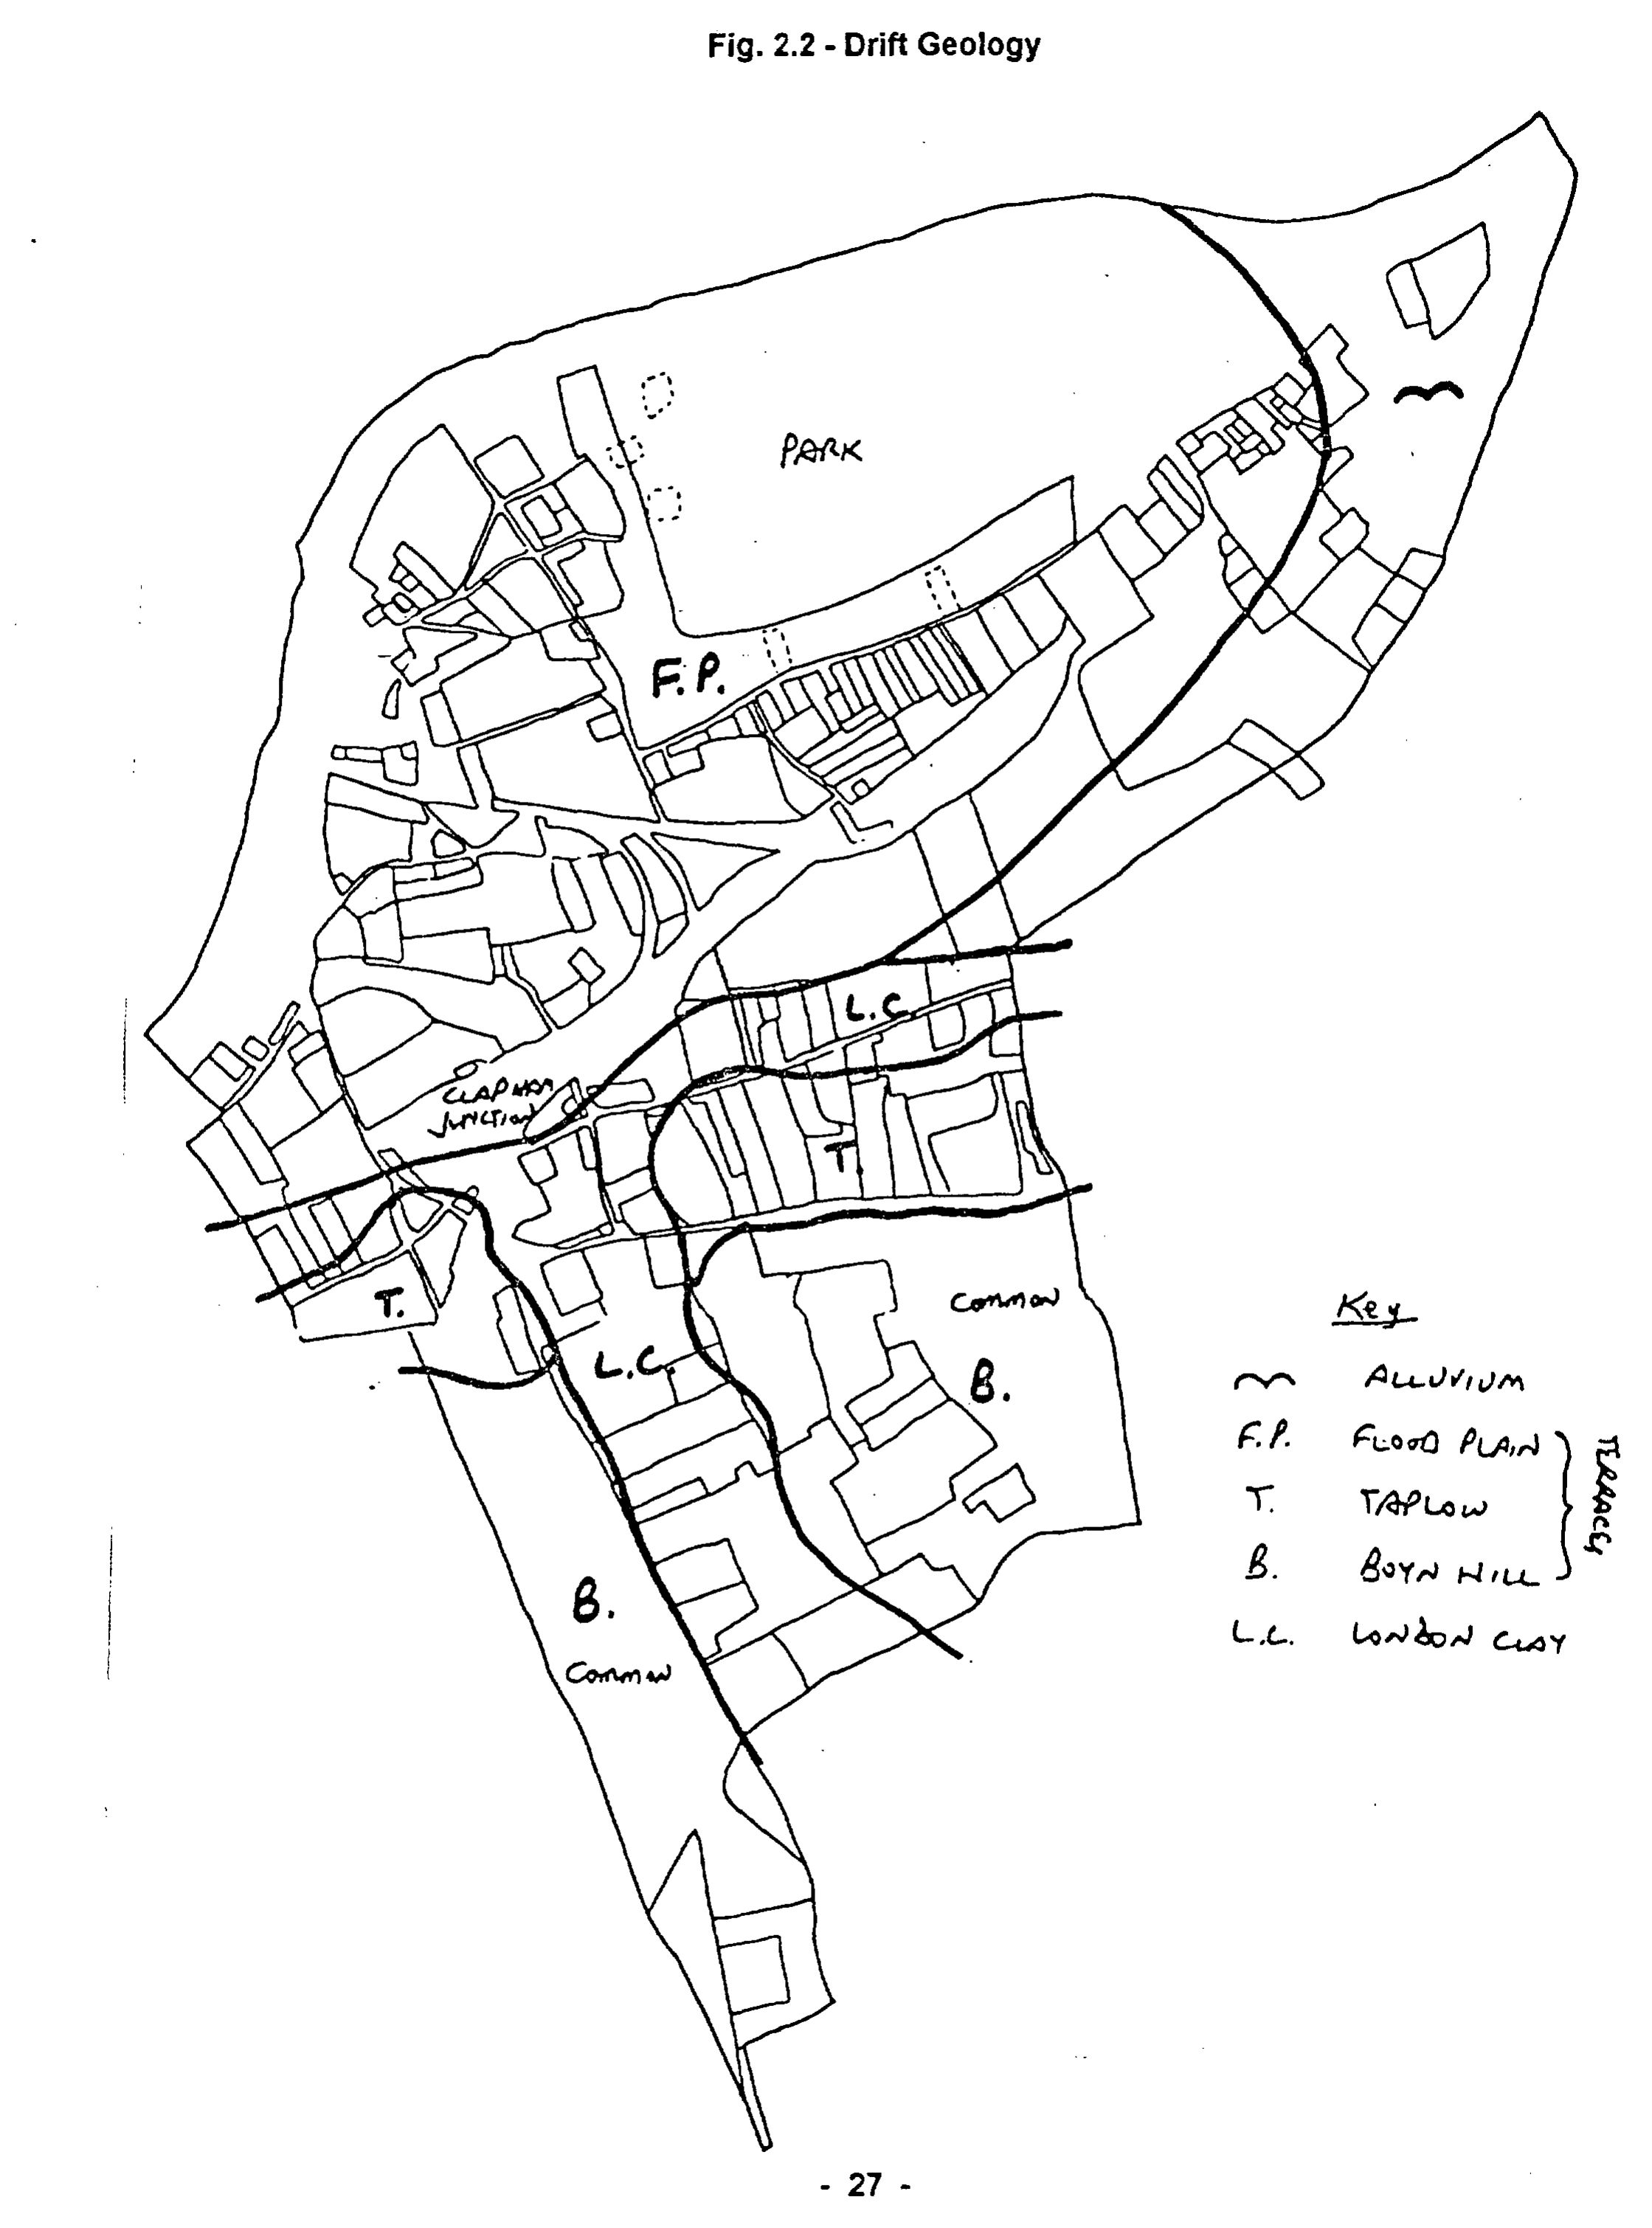
Battersea parish covers 2315 acres (excluding 770 acres at Penge, which although part of Battersea until 1888, is not treated here), similar to Wandsworth, Streatham and Putney, larger than Clapham, but smaller than Lambeth and Camberwell. There are four landscape units, defined by superficial geology and relief (Fig. 2.1).
The largest unit (57%), is the Thames Flood Plain Terrace. These gravels, loams and sands are the lowest of several such terraces, marking a progressive lowering of the river during and since the Ice Age.1 The Flood Plain lies between 10 and 30ft. O.D., producing generally fertile soils which formed the basis of Battersea’s Common Field, covering c.400 acres east of the ancient village. This fertility was the basis for commercial horticulture after 1600.2 By 1800, Battersea was renowned for its asparagus and lavender.3
Parts of the Flood Plain were covered with loess, a fine wind-blown clayey loam, known as brickearth.4 The paradox of first-rate farmland which carried the seeds of its own destruction is repeated across London, and several estates evolved from market gardens to brickfields to housing. Brickearth was used for commercial brickmaking long before the Victorian era. In 1638-9, Robert Taylor was licensed to make 445,000 bricks at a kiln on Latchmere Common, of which 195,000 were used in rebuilding the tower of St. Mary’s church.5 Most surviving pre-1800 houses in Battersea are brick-built, probably using local sources.
A small area around Nine Elms and a strip along the river is formed from the most recent alluvial deposits (4-5% of the total). Essentially marshy, it was subject to flooding until embanked from medieval times to the 1840s. Nine Elms was noted for its willows and generally Dutch aspect as late as the 1830s.6
The third component is the London Clay (12% rising to 22% in SW Battersea). It is exposed in the slopes of the north-south Falcon Brook valley, and in the prominent east-west bluff from Queenstown Road to Usk Road. Erosion has produced steep slopes 30-35ft. high. London Clay tends to be very heavy when wet and hard when dry and therefore not ideal for arable farming.7 Much of the clay was used for grazing and for the grounds of large houses before development. The east-west bluff divides north and south Battersea, and also generally working-class housing from that aimed at the middle classes. The London & Southampton Railway, built across the Flood Plain in 1834-8, does not form a major social demarcation. Despite their steepness, the clay slopes did not form a barrier to the Victorian builder.
The higher ground is covered by two further terrace deposits (27%), the Taplow and
Open zoomable view
Open zoomable view
p. 28Boyn Hill Terraces, at about 45-60ft. and 80-100ft. O.D. respectively.8 They are an assortment of sands, gravels and loams, but longer erosion has rendered them less fertile and attractive for agriculture, especially the Boyn Hill deposits which underlie the extensive tracts of manorial waste (now Clapham and Wandsworth Commons). The northern part of the Taplow Terrace was enclosed early, and may never have been open field. These areas have long been regarded as the most salubrious, combining an elevated position with fine views over London and good natural drainage. Almost all of the mansions built after 1750 were around the commons, their estates not developed until after 1880.
In summary, the topography of Battersea may be likened to a “T”, in which the crossbar is the low-lying north of the parish, the site of the medieval village and its common field. The commercial horticulture which developed after 1600 delayed widespread enclosure until the onset of housebuilding from 1840. The downstroke is formed by the Falcon Brook, whose valley is bounded by steep London Clay slopes capped by flat expanses of gravel. This area was relatively sparsely settled before 1700, and not finally covered by the tide of suburban building until 1914.
II – Battersea in the Eighteenth Century
In 1740, Battersea had over 400 acres of open field, the rest being enclosed or waste. This early enclosure may relate to the disappearance of Anglo-Saxon Wassingham in the centre of the parish.9 Battersea village lay along the Thames and the High Street. It contained about 170 houses in 1740. The rest of the parish had only 150 houses, many in clusters representing medieval hamlets such as York Place, and Roydon.
Nine Elms was first mentioned in 1645 and developed as a riverside industrial area. Brewing was carried on there until the 1960s, and ‘Mr. Dawes the Whitinge Maker’ of 1649 was the forerunner of another long-lived industry.10 The area was noted for its windmills, which processed not only corn, but also white lead and colour.11 Timber was important here, with docks rented from the parish, and formed the basis of the later shipbuilding industry, which lasted until the general collapse of that trade in London in the 1860s.12 Sugar and lime manufacture were other local industries relying on the carriage of bulky goods by river. A tidal mill with a large storage pond was a feature of Nine Elms from 1770 until 1860.
Industry was not confined to Nine Elms, however, and 1750 saw the opening of the Battersea enamel works at York House, once the residence of the archbishops.13 It failed in the 1770s, and was replaced by a distillery, one of several in Battersea and Wandsworth catering for the demand for gin in London.14 A silk manufactory was set up nearby in the 1780s. Close to the manor house, the so-called “horizontal mill” was built in the 1790s, being used for corn- and saw-milling during a varied career.15 Nearby, Marc Brunel, father of I.K., had a factory for the mass-production of army boots during the Napoleonic Wars.16
The impact of all this activity on the local population is unclear. Lysons suggests that the population in the 1580s may have been only 400-500, rapidly increasing to c.2,000 in 1690.17 (Cf. estimated growth from 600 to 1,800 in Putney, 1620-1700.18) Thereafter, Battersea’s population stagnated, despite continued industrial growth and the movement of
p. 29wealthy Londoners into the area, both of which provided employment in a wide variety of jobs. Lysons suggests a total of 2,100 by 1790. The population of 3,365 in 1801 reflects very rapid growth during the 1790s, much of it at Battersea New Town (see Chap. 13).
This view of stagnation during the eighteenth century is supported by the Poor Rate assessments. In the 1760s, there were 340 houses in Battersea, of which half were in the Village, with the rest more or less equally divided between York Place, The Rise/Commons and Nine Elms. In 1794, the figure was 390 houses, the increase being at York Place (31) and The Rise (19). Taking the average of 6-6½ persons/house which is typical throughout the nineteenth century, we have a population of 2,070-2,240 in the 1760s and 1794, close to Lysons’ estimates. The significant growth at York Place was caused by the erection of thirty-odd cottages for silk weavers. Around the Commons, several substantial houses for the gentry and mercantile classes had been put up after 1770.
The reason for the cessation of growth in Battersea is unclear. Putney continued to grow during the eighteenth century, albeit more slowly than before. Lysons adduced poor communications with London, and saw the opening of Battersea Bridge (November 1771) as a catalyst of renewed growth.19 This is difficult to accept. Battersea had always been served by two major roads from London and by the Thames. Londoners in search of country retreats did not find it inaccessible.
The Chelsea-Battersea ferry was far less important than that at Putney, and was not part of a important route from London.20 Agitation for a bridge in 1661 was defeated, as at Putney, by the watermen’s lobby. Putney acquired its toll bridge in 1729, but Battersea had to wait for Earl Spencer, recently arrived as lord of the manor, to obtain an Act in 1766.21 Poor access from the south meant that receipts were disappointing. The relevance of Battersea Bridge to the prospects for local industrial and population growth must remain questionable. When the area did finally emerge from the doldrums after 1790, it owed much more to the stimulus of the war economy, and the centre of growth was at Nine Elms.
Rate books also provide data on house values and hence the social geography of Georgian Battersea.
| Area | % Houses | % Value |
|---|---|---|
| Village | 49.4 | 35.5 |
| York Place | 15.7 | 11.1 |
| The Rise | 19.4 | 27.8 |
| Nine Elms | 15.5 | 26.6 |
Source: Battersea Poor Rate assessments 1760-9 (WLHC)
Even in the 1760s, marked differences existed between the various parts of Battersea. The Village, with half the houses, had only one-third of the rateable value, and York Place was also an area of low-value property. The Rise was valued at 43% more than might have been expected from the number of houses. The excess value at Nine Elms, on the other hand, reflects the fact that many houses had industrial premises alongside, which were not
p. 30distinguished separately. The average assessment 9/7 in the village; 11/- at York Place; 19/5 at the Rise and 21/9 at Nine Elms. The overall average was 13/3.
III – Battersea in the Early Nineteenth Century
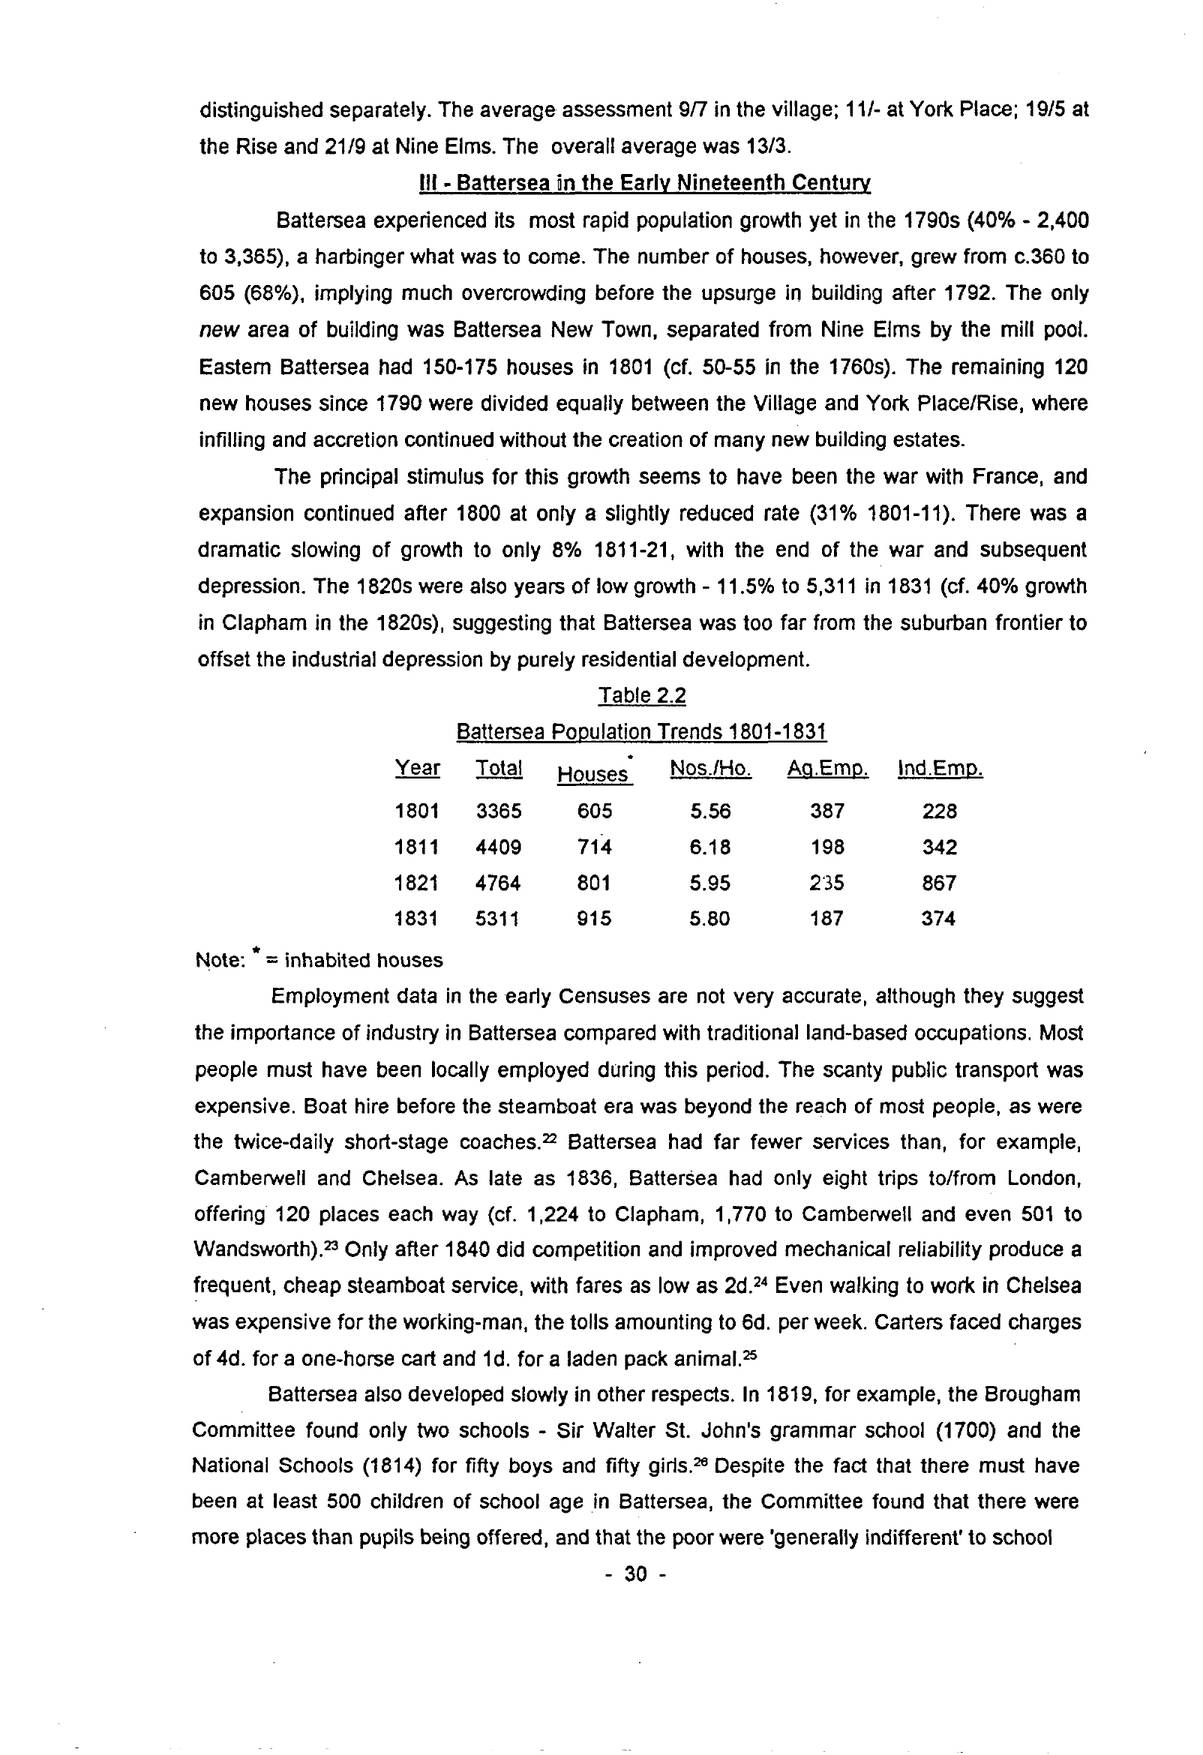
Battersea experienced its most rapid population growth yet in the 1790s (40% – 2,400 to 3,365), a harbinger what was to come. The number of houses, however, grew from c.360 to 605 (68%), implying much overcrowding before the upsurge in building after 1792. The only new area of building was Battersea New Town, separated from Nine Elms by the mill pool. Eastern Battersea had 150-175 houses in 1801 (cf. 50-55 in the 1760s). The remaining 120 new houses since 1790 were divided equally between the Village and York Place/Rise, where infilling and accretion continued without the creation of many new building estates.
The principal stimulus for this growth seems to have been the war with France, and expansion continued after 1800 at only a slightly reduced rate (31% 1801-11). There was a dramatic slowing of growth to only 8% 1811-21, with the end of the war and subsequent depression. The 1820s were also years of low growth – 11.5% to 5,311 in 1831 (cf. 40% growth in Clapham in the 1820s), suggesting that Battersea was too far from the suburban frontier to offset the industrial depression by purely residential development.
| Year | Total | Houses* | Nos./Ho. | Ag.Emp. | Ind.Emp. |
|---|---|---|---|---|---|
| 1801 | 3365 | 605 | 5.56 | 387 | 228 |
| 1811 | 4409 | 714 | 6.18 | 198 | 342 |
| 1821 | 4764 | 801 | 5.95 | 235 | 867 |
| 1831 | 5311 | 915 | 5.80 | 187 | 374 |
Note: * = inhabited houses
Employment data in the early Censuses are not very accurate, although they suggest the importance of industry in Battersea compared with traditional land-based occupations. Most people must have been locally employed during this period. The scanty public transport was expensive. Boat hire before the steamboat era was beyond the reach of most people, as were the twice-daily short-stage coaches.22 Battersea had far fewer services than, for example, Camberwell and Chelsea. As late as 1836, Battersea had only eight trips to/from London, offering 120 places each way (cf. 1,224 to Clapham, 1,770 to Camberwell and even 501 to Wandsworth).23 Only after 1840 did competition and improved mechanical reliability produce a frequent, cheap steamboat service, with fares as low as 2d.24 Even walking to work in Chelsea was expensive for the working-man, the tolls amounting to 6d. per week. Carters faced charges of 4d. for a one-horse cart and 1d. for a laden pack animal.25
Battersea also developed slowly in other respects. In 1819, for example, the Brougham Committee found only two schools – Sir Walter St. John’s grammar school (1700) and the National Schools (1814) for fifty boys and fifty girls.26 Despite the fact that there must have been at least 500 children of school age in Battersea, the Committee found that there were more places than pupils being offered, and that the poor were ‘generally indifferent’ to school
p. 31attendance, no doubt preferring to set their children earning in field or factory. The Battersea Charity School, founded under the aegis of the Baptist Chapel in York Road in 1799, seems to have been overlooked. The roll was 88 in 1843, but attendance averaged only 64.27
Provision of additional church facilities was equally slow. The parish church was rebuilt 1775-7, but could only accommodate a small proportion of the population by 1800.28 There was a ‘chapel’ of unspecified denomination at New Town in 1813, but the first new church was St. George’s, built in 1829-30 for about £2,500.29 No more established churches were built until the late 1840s.
There was no integrated drainage provision in London until the Metropolitan Board of Works took the matter in hand after 1856, although the generally well-drained subsoil of Battersea no doubt helped to avoid the worst health problems. Flooding east and south of the village remained a problem, however. Water supply was from local wells and watercourses. The Southwark & Vauxhall Water Company took its supply from the polluted waters of the Thames west of Nine Elms, and the quality and regularity of supplies were far from good.30
IV: Battersea in 1839
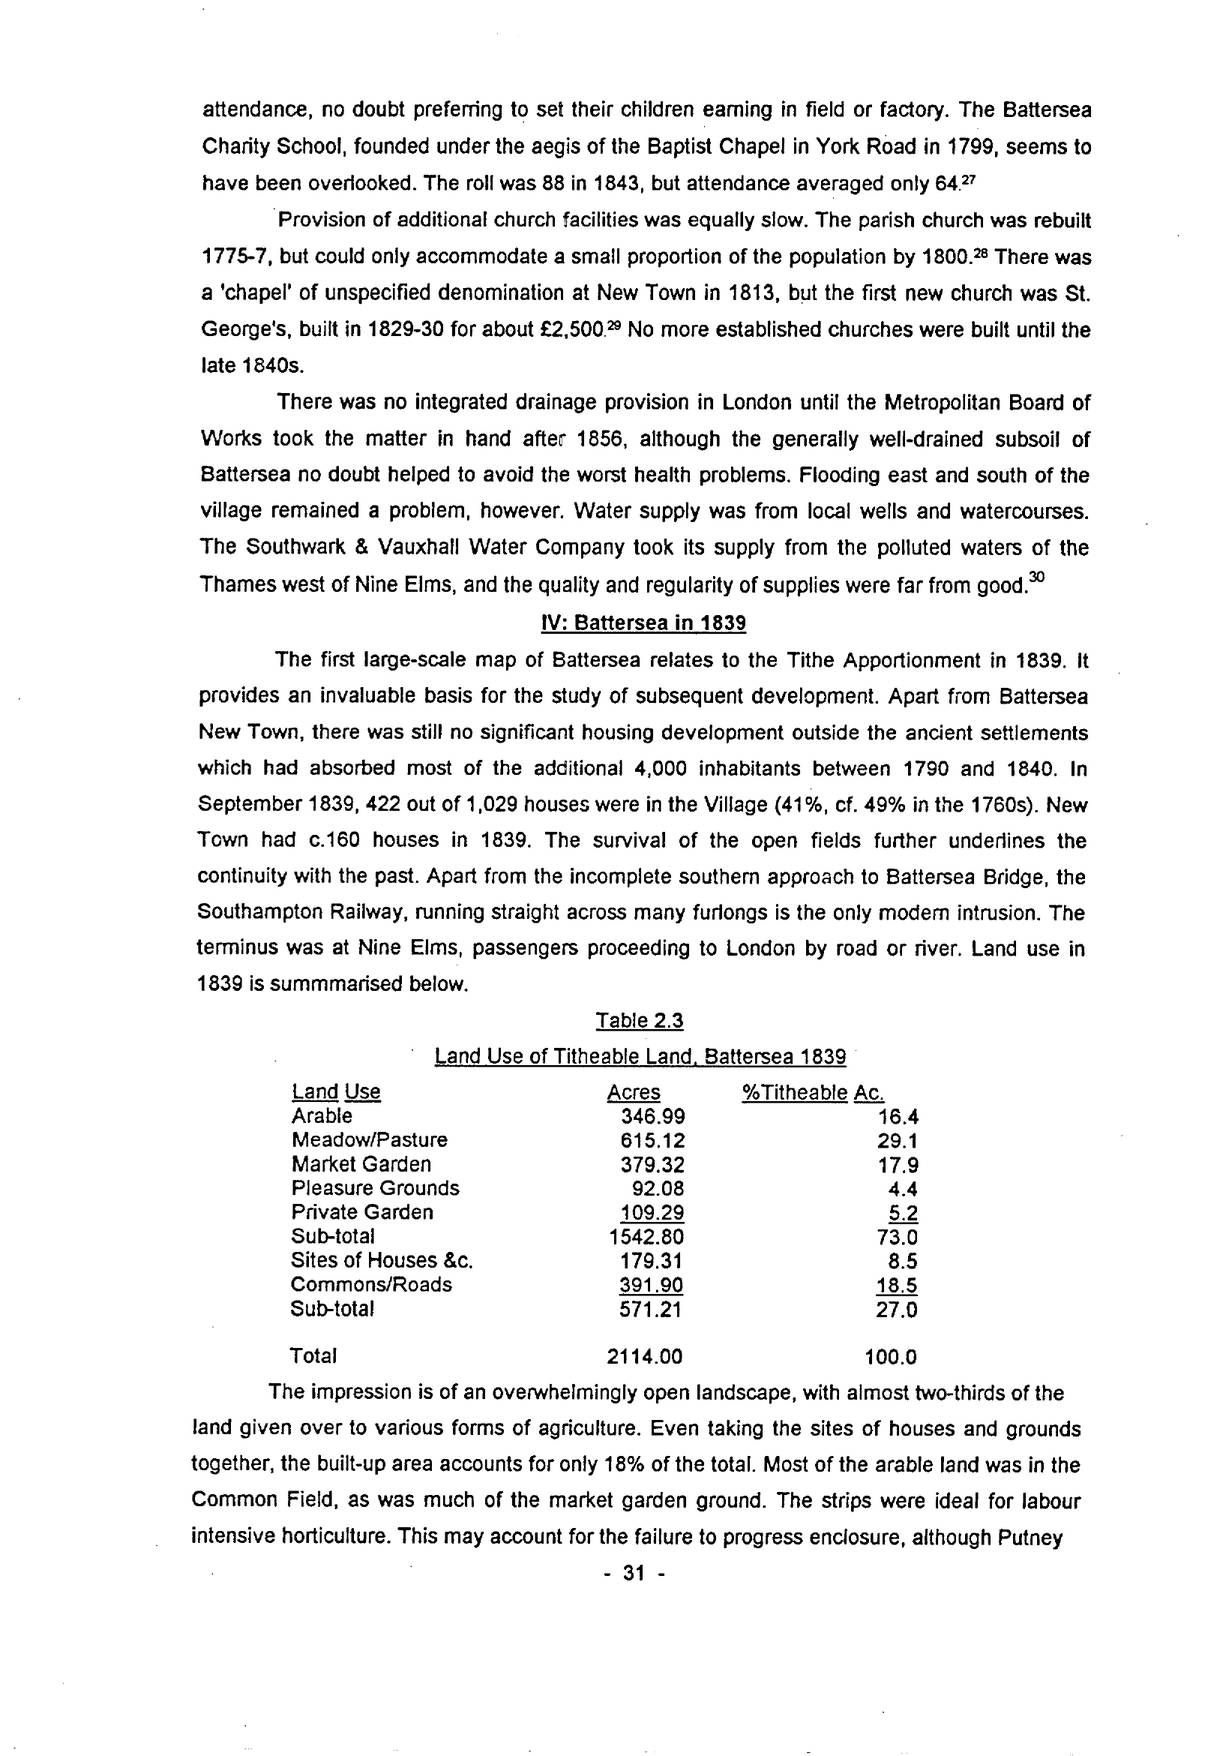
The first large-scale map of Battersea relates to the Tithe Apportionment in 1839. It provides an invaluable basis for the study of subsequent development. Apart from Battersea New Town, there was still no significant housing development outside the ancient settlements which had absorbed most of the additional 4,000 inhabitants between 1790 and 1840. In September 1839, 422 out of 1,029 houses were in the Village (41%, cf. 49% in the 1760s). New Town had c.160 houses in 1839. The survival of the open fields further underlines the continuity with the past. Apart from the incomplete southern approach to Battersea Bridge, the Southampton Railway, running straight across many furlongs is the only modern intrusion. The terminus was at Nine Elms, passengers proceeding to London by road or river. Land use in 1839 is summarised below.
| Land Use | Acres | %Titheable Ac. |
|---|---|---|
| Arable | 346.99 | 16.4 |
| Meadow/Pasture | 615.12 | 29.1 |
| Market Garden | 379.32 | 17.9 |
| Pleasure Grounds | 92.08 | 4.4 |
| Private Garden | 109.29 | 5.2 |
| Sub-total | 1542.80 | 73.0 |
| Sites of Houses &c. | 179.31 | 8.5 |
| Commons/Roads | 391.90 | 18.5 |
| Sub-total | 571.21 | 27.0 |
| Total | 2114.00 | 100.0 |
The impression is of an overwhelmingly open landscape, with almost two-thirds of the land given over to various forms of agriculture. Even taking the sites of houses and grounds together, the built-up area accounts for only 18% of the total. Most of the arable land was in the Common Field, as was much of the market garden ground. The strips were ideal for labour intensive horticulture. This may account for the failure to progress enclosure, although Putney
p. 32had a similar emphasis on market gardening and was fully enclosed by 1750. Meadow and pasture represent the major land use on the higher, poorer soils, producing hay and fatstock for the London market. The infertile soils in the south-east and south-west account for the substantial area of wastes and common, although these too were used for grazing. In all essentials, this pattern of land use is the same as in 1800.31 Milne shows the patchwork of arable and market gardens in the open field and the great blocks of pasture in the Falcon Brook valley and north side of Clapham Common.
The first railway made little physical impact. The industrial zone at Nine Elms gave way abruptly at the tidal mill to marshland dotted with mills, taverns and gardens such as the notorious “Red House”,32 a pigeon-shooting ground and the more genteel Flora Tea Garden. Battersea New Town had still not reached anything like its final form, despite fifty years of building. Most of the houses there had rental values of £10 or less. Between New Town and the Village were open fields, with no hint of the first surge of building which was to come after 1840.
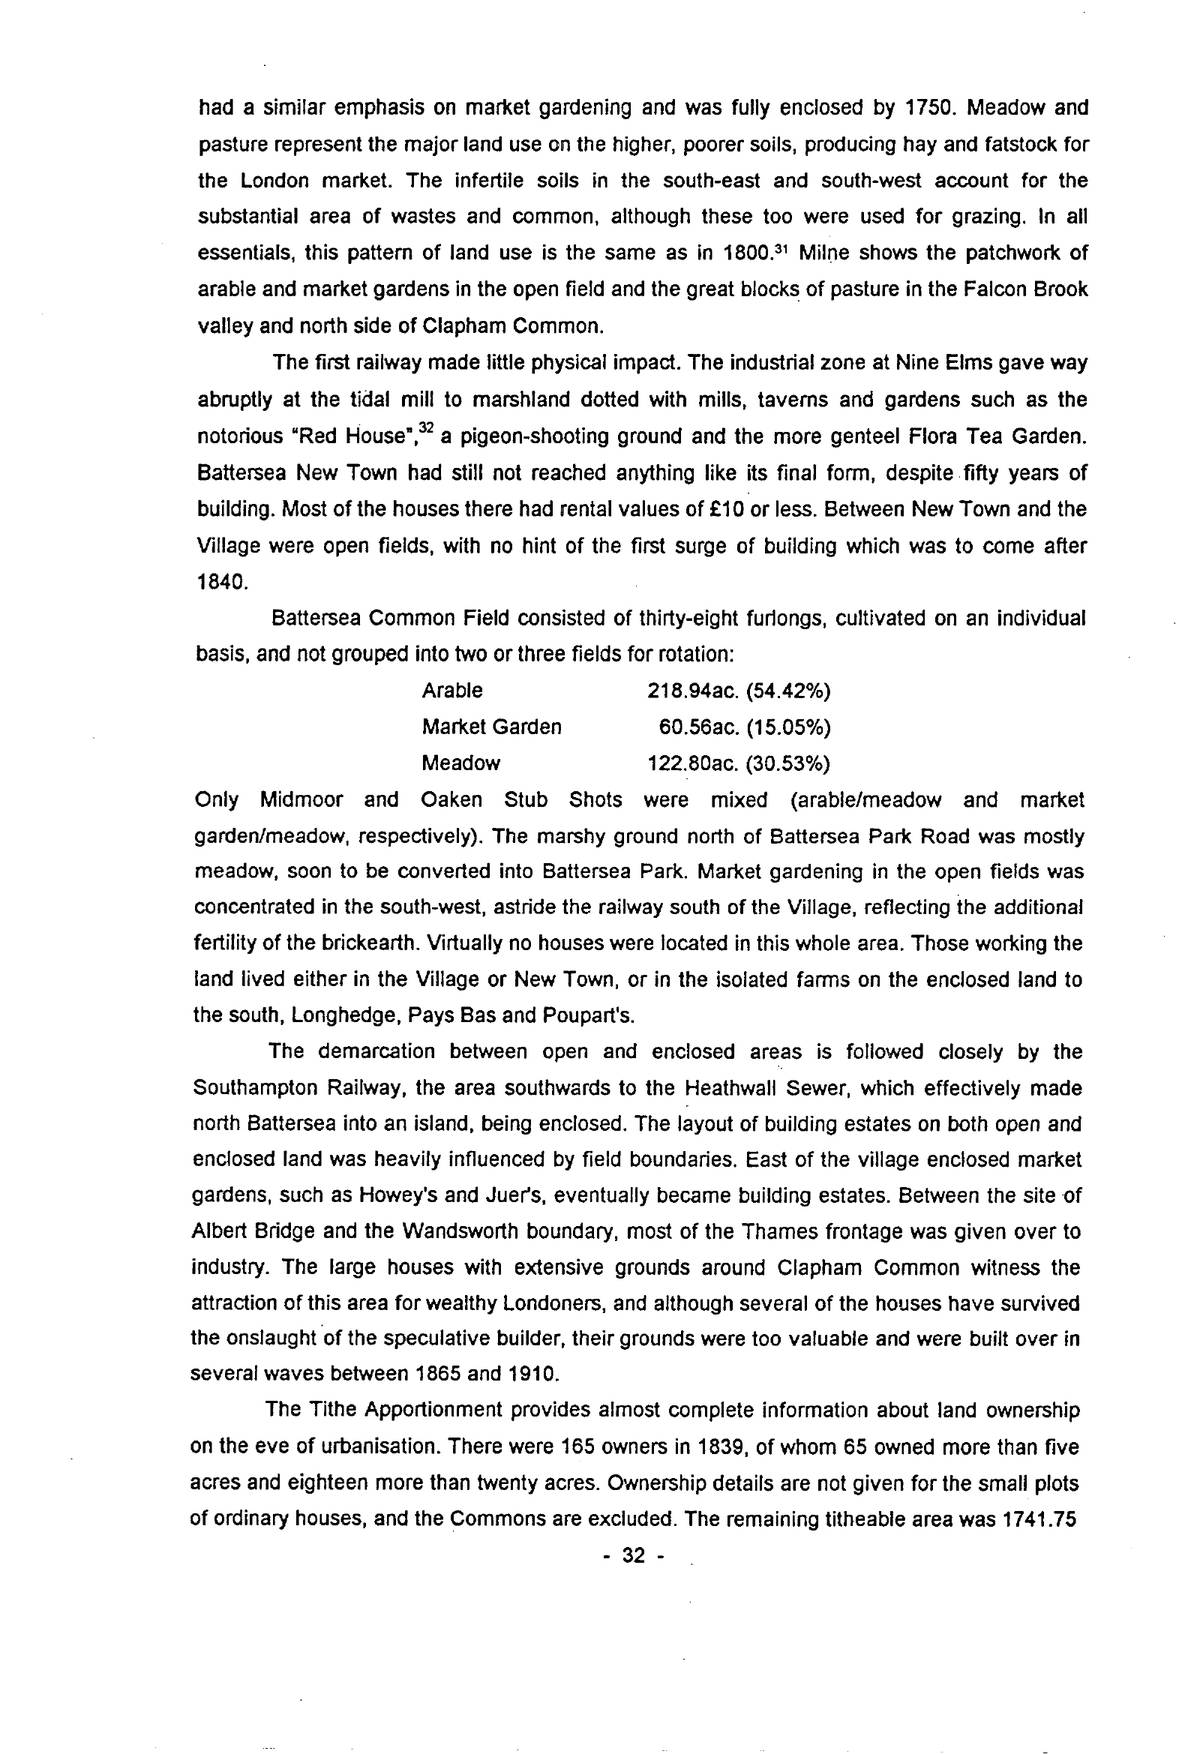
Battersea Common Field consisted of thirty-eight furlongs, cultivated on an individual basis, and not grouped into two or three fields for rotation:
| Arable | 218.94ac. (54.42%) |
| Market Garden | 60.56ac. (15.05%) |
| Meadow | 122.80ac. (30.53%) |
Only Midmoor and Oaken Stub Shots were mixed (arable/meadow and market garden/meadow, respectively). The marshy ground north of Battersea Park Road was mostly meadow, soon to be converted into Battersea Park. Market gardening in the open fields was concentrated in the south-west, astride the railway south of the Village, reflecting the additional fertility of the brickearth. Virtually no houses were located in this whole area. Those working the land lived either in the Village or New Town, or in the isolated farms on the enclosed land to the south, Longhedge, Pays Bas and Poupart’s.
The demarcation between open and enclosed areas is followed closely by the Southampton Railway, the area southwards to the Heathwall Sewer, which effectively made north Battersea into an island, being enclosed. The layout of building estates on both open and enclosed land was heavily influenced by field boundaries. East of the village enclosed market gardens, such as Howey’s and Juer’s, eventually became building estates. Between the site of Albert Bridge and the Wandsworth boundary, most of the Thames frontage was given over to industry. The large houses with extensive grounds around Clapham Common witness the attraction of this area for wealthy Londoners, and although several of the houses have survived the onslaught of the speculative builder, their grounds were too valuable and were built over in several waves between 1865 and 1910.
The Tithe Apportionment provides almost complete information about land ownership on the eve of urbanisation. There were 165 owners in 1839, of whom 65 owned more than five acres and eighteen more than twenty acres. Ownership details are not given for the small plots of ordinary houses, and the Commons are excluded. The remaining titheable area was 1741.75
p. 33acres. Of this, the ten largest owners held 829.38 acres (47.62%). This is not to say, however, that holdings of less than ten acres were too small for viable building developments. Many “building estates” covered less than one acre.
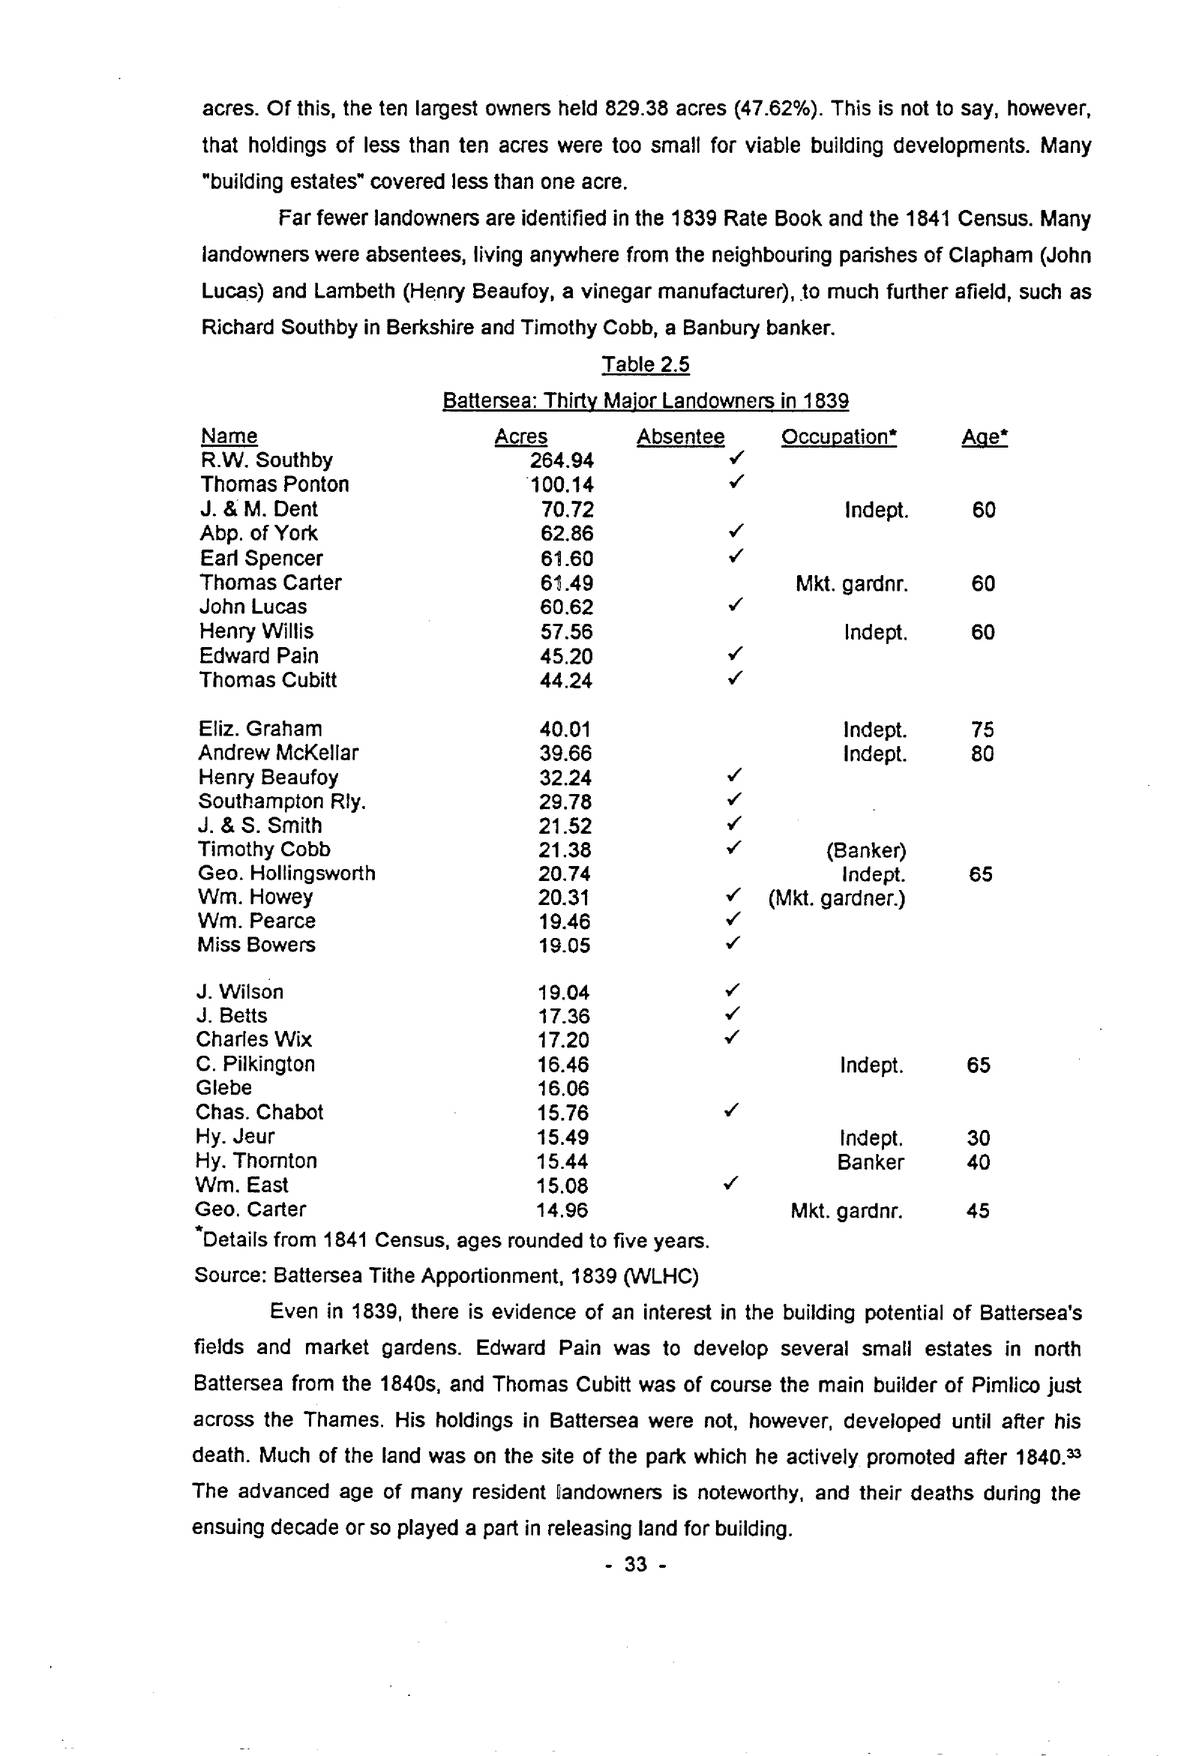
Far fewer landowners are identified in the 1839 Rate Book and the 1841 Census. Many landowners were absentees, living anywhere from the neighbouring parishes of Clapham (John Lucas) and Lambeth (Henry Beaufoy, a vinegar manufacturer), to much further afield, such as Richard Southby in Berkshire and Timothy Cobb, a Banbury banker.
| Name | Acres | Absentee | Occupation* | Age* |
|---|---|---|---|---|
| R.W. Southby | 264.94 | ✓ | ||
| Thomas Ponton | 100.14 | ✓ | ||
| J. & M. Dent | 70.72 | Indept. | 60 | |
| Abp. of York | 62.86 | ✓ | ||
| Earl Spencer | 61.60 | ✓ | ||
| Thomas Carter | 61.49 | Mkt. gardnr. | 60 | |
| John Lucas | 60.62 | ✓ | ||
| Henry Willis | 57.56 | Indept. | 60 | |
| Edward Pain | 45.20 | ✓ | ||
| Thomas Cubitt | 44.24 | ✓ | ||
| Eliz. Graham | 40.01 | Indept. | 75 | |
| Andrew McKellar | 39.66 | Indept. | 80 | |
| Henry Beaufoy | 32.24 | ✓ | ||
| Southampton Rly. | 29.78 | ✓ | ||
| J. & S. Smith | 21.52 | ✓ | ||
| Timothy Cobb | 21.38 | ✓ | (Banker) | |
| Geo. Hollingsworth | 20.74 | Indept. | 65 | |
| Wm. Howey | 20.31 | ✓ | (Mkt. gardner.) | |
| Wm. Pearce | 19.46 | ✓ | ||
| Miss Bowers | 19.05 | ✓ | ||
| J. Wilson | 19.04 | ✓ | ||
| J. Betts | 17.36 | ✓ | ||
| Charles Wix | 17.20 | ✓ | ||
| C. Pilkington | 16.46 | Indept. | 65 | |
| Glebe | 16.06 | |||
| Chas. Chabot | 15.76 | ✓ | ||
| Hy. Jeur | 15.49 | Indept. | 30 | |
| Hy. Thornton | 15.44 | Banker | 40 | |
| Wm. East | 15.08 | ✓ | ||
| Geo. Carter | 14.96 | Mkt. gardnr. | 45 |
*Details from 1841 Census, ages rounded to five years.
Source: Battersea Tithe Apportionment, 1839 (WLHC)
Even in 1839, there is evidence of an interest in the building potential of Battersea’s fields and market gardens. Edward Pain was to develop several small estates in north Battersea from the 1840s, and Thomas Cubitt was of course the main builder of Pimlico just across the Thames. His holdings in Battersea were not, however, developed until after his death. Much of the land was on the site of the park which he actively promoted after 1840.33 The advanced age of many resident landowners is noteworthy, and their deaths during the ensuing decade or so played a part in releasing land for building.
p. 34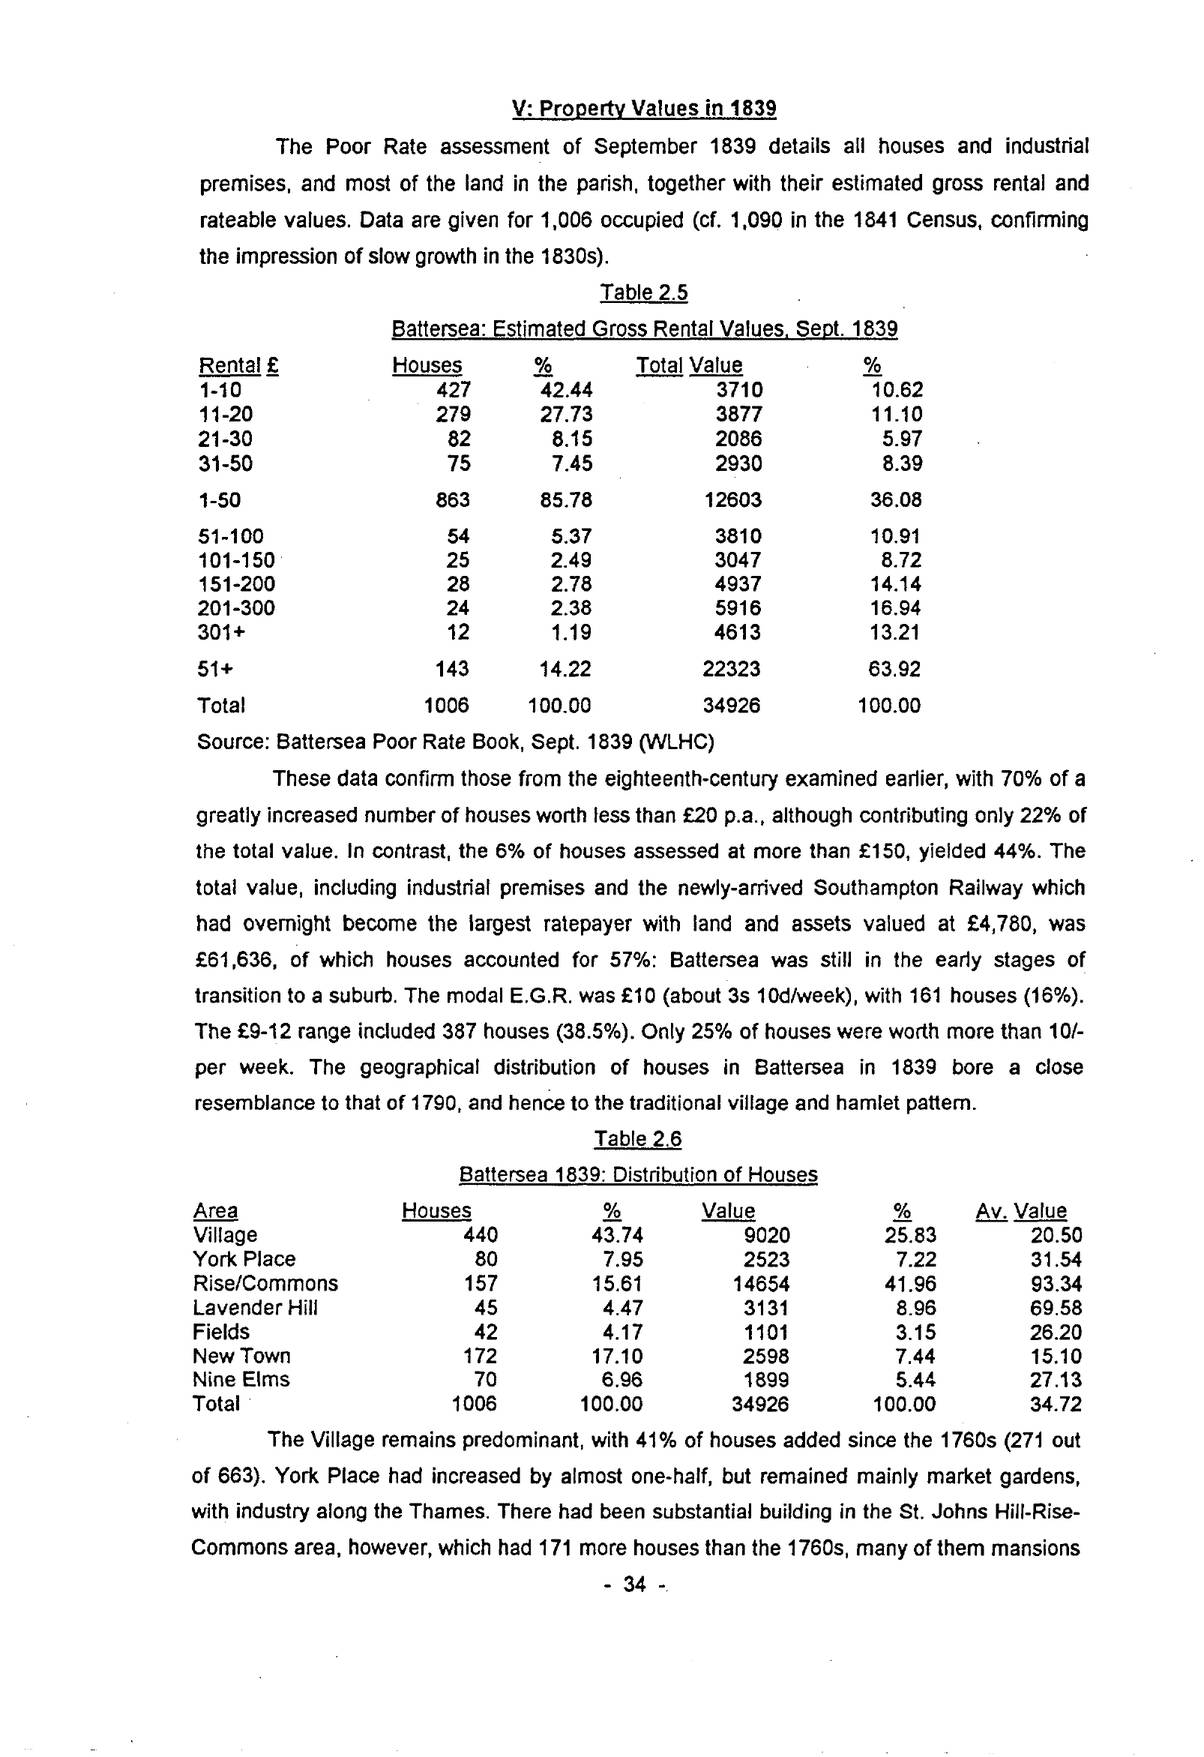
V: Property Values in 1839
The Poor Rate assessment of September 1839 details all houses and industrial premises, and most of the land in the parish, together with their estimated gross rental and rateable values. Data are given for 1,006 occupied (cf. 1,090 in the 1841 Census, confirming the impression of slow growth in the 1830s).
| Rental £ | Houses | % | Total Value | % |
|---|---|---|---|---|
| 1-10 | 427 | 42.44 | 3710 | 10.62 |
| 11-20 | 279 | 27.73 | 3877 | 11.10 |
| 21-30 | 82 | 8.15 | 2086 | 5.97 |
| 31-50 | 75 | 7.45 | 2930 | 8.39 |
| 1-50 | 863 | 85.78 | 12603 | 36.08 |
| 51-100 | 54 | 5.37 | 3810 | 10.91 |
| 101-150 | 25 | 2.49 | 3047 | 8.72 |
| 151-200 | 28 | 2.78 | 4937 | 14.14 |
| 201-300 | 24 | 2.38 | 5916 | 16.94 |
| 301+ | 12 | 1.19 | 4613 | 13.21 |
| 51+ | 143 | 14.22 | 22323 | 63.92 |
| Total | 1006 | 100.00 | 34926 | 100.00 |
Source: Battersea Poor Rate Book, Sept. 1839 (WLHC)
These data confirm those from the eighteenth-century examined earlier, with 70% of a greatly increased number of houses worth less than £20 p.a., although contributing only 22% of the total value. In contrast, the 6% of houses assessed at more than £150, yielded 44%. The total value, including industrial premises and the newly-arrived Southampton Railway which had overnight become the largest ratepayer with land and assets valued at £4,780, was £61,636, of which houses accounted for 57%: Battersea was still in the early stages of transition to a suburb. The modal E.G.R. was £10 (about 3s 10d/week), with 161 houses (16%). The £9-12 range included 387 houses (38.5%). Only 25% of houses were worth more than 10/- per week. The geographical distribution of houses in Battersea in 1839 bore a close resemblance to that of 1790, and hence to the traditional village and hamlet pattern.
| Area | Houses | % | Value | % | Av. Value |
|---|---|---|---|---|---|
| Village | 440 | 43.74 | 9020 | 25.83 | 20.50 |
| York Place | 80 | 7.95 | 2523 | 7.22 | 31.54 |
| Rise/Commons | 157 | 15.61 | 14654 | 41.96 | 93.34 |
| Lavender Hill | 45 | 4.47 | 3131 | 8.96 | 69.58 |
| Fields | 42 | 4.17 | 1101 | 3.15 | 26.20 |
| New Town | 172 | 17.10 | 2598 | 7.44 | 15.10 |
| Nine Elms | 70 | 6.96 | 1899 | 5.44 | 27.13 |
| Total | 1006 | 100.00 | 34926 | 100.00 | 34.72 |
The Village remains predominant, with 41% of houses added since the 1760s (271 out of 663). York Place had increased by almost one-half, but remained mainly market gardens, with industry along the Thames. There had been substantial building in the St. Johns Hill-Rise-Commons area, however, which had 171 more houses than the 1760s, many of them mansions
p. 35with substantial grounds, and E.G.Rs. of £200 or more. Lavender Hill had also attracted this kind of development to an area virtually uninhabited in 1770. The Common Field and adjacent enclosures remained largely untouched by building in 1839. To the east, however, Battersea New Town had 172 houses where none existed before. Nine Elms, in contrast, had acquired only 27 houses. The Village and New Town stand out as low value areas. South Battersea had half of the value but only 20% of the houses. Even here, however, small cottage properties lay close to the great houses.
VI: The Spencer Sales of 1835/6
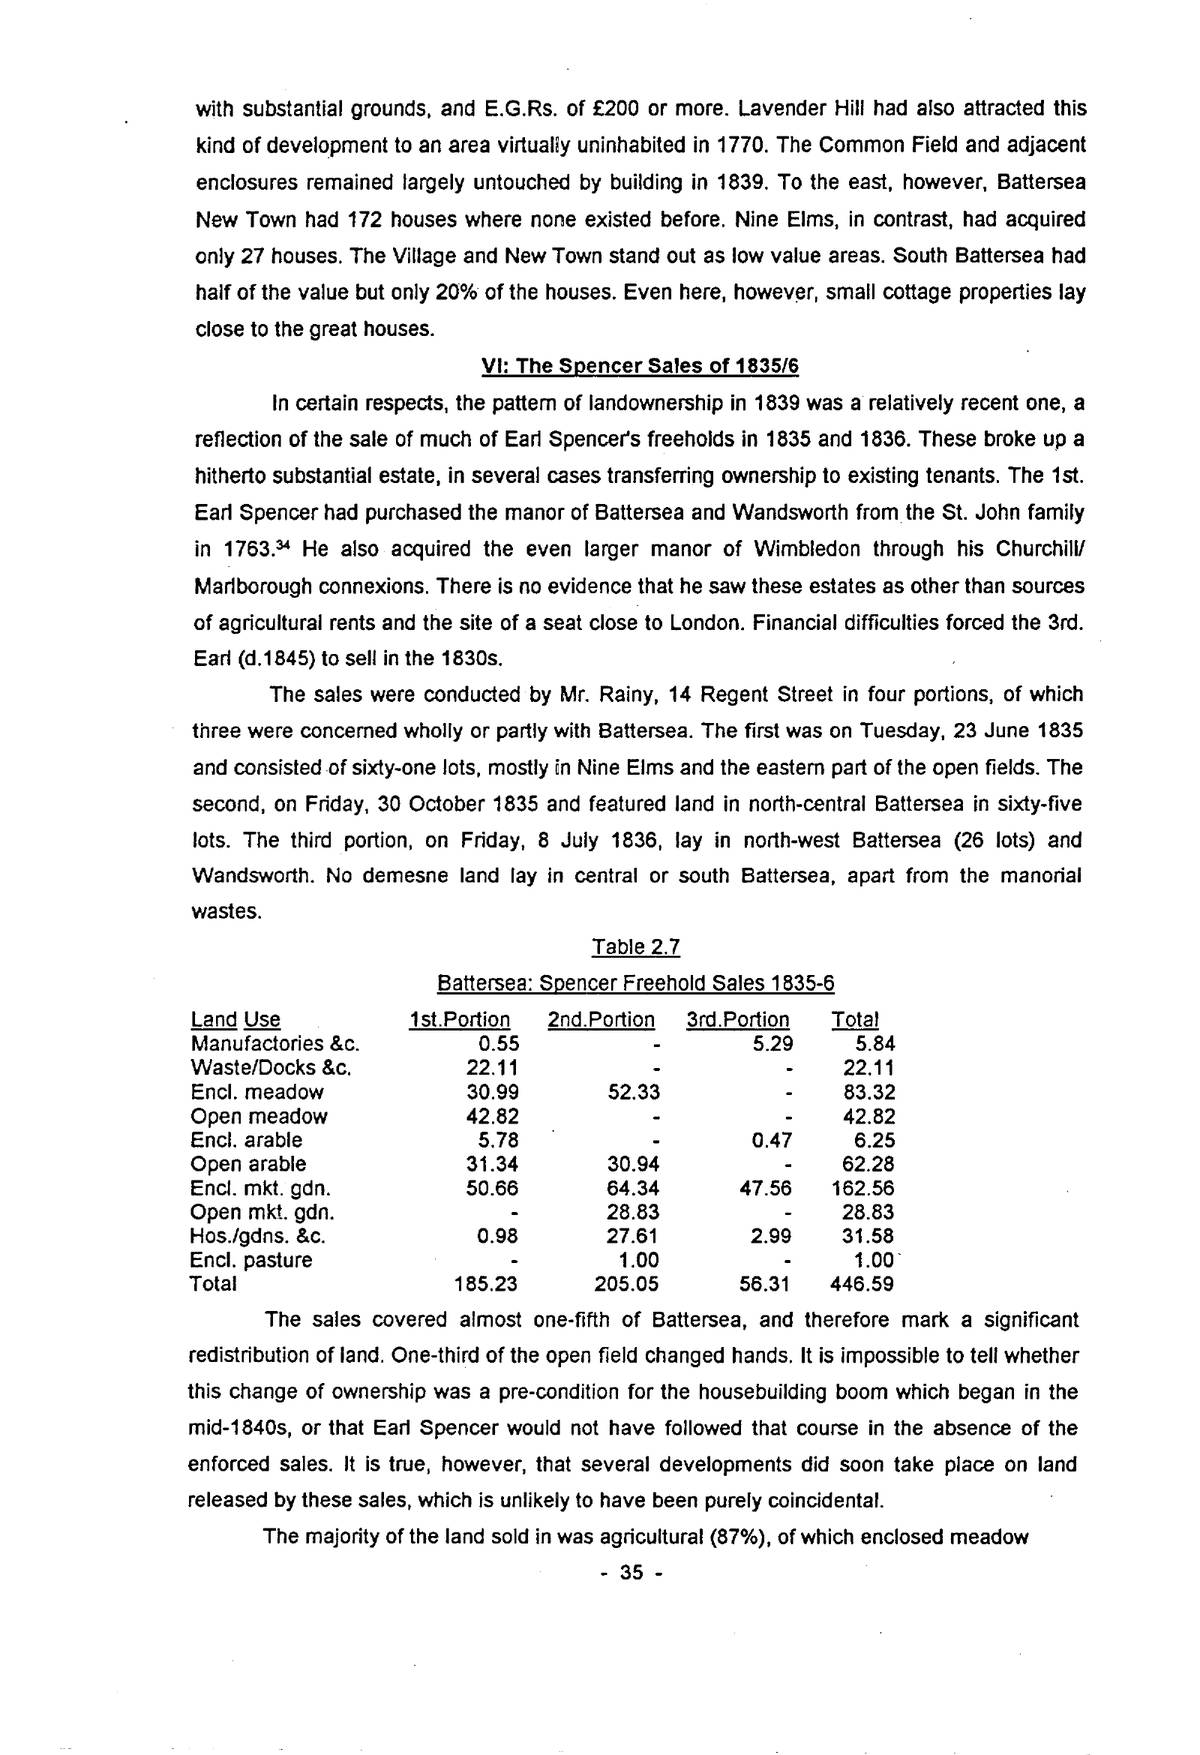
In certain respects, the pattern of landownership in 1839 was a relatively recent one, a reflection of the sale of much of Earl Spencer’s freeholds in 1835 and 1836. These broke up a hitherto substantial estate, in several cases transferring ownership to existing tenants. The 1st. Earl Spencer had purchased the manor of Battersea and Wandsworth from the St. John family in 1763.34 He also acquired the even larger manor of Wimbledon through his Churchill/Marlborough connexions. There is no evidence that he saw these estates as other than sources of agricultural rents and the site of a seat close to London. Financial difficulties forced the 3rd. Earl (d.1845) to sell in the 1830s.
The sales were conducted by Mr. Rainy, 14 Regent Street in four portions, of which three were concerned wholly or partly with Battersea. The first was on Tuesday, 23 June 1835 and consisted of sixty-one lots, mostly in Nine Elms and the eastern part of the open fields. The second, on Friday, 30 October 1835 and featured land in north-central Battersea in sixty-five lots. The third portion, on Friday, 8 July 1836, lay in north-west Battersea (26 lots) and Wandsworth. No demesne land lay in central or south Battersea, apart from the manorial wastes.
| Land Use | 1st.Portion | 2nd.Portion | 3rd.Portion | Total |
|---|---|---|---|---|
| Manufactories &c. | 0.55 | – | 5.29 | 5.84 |
| Waste/Docks &c. | 22.11 | – | – | 22.11 |
| Encl. meadow | 30.99 | 52.33 | – | 83.32 |
| Open meadow | 42.82 | – | – | 42.82 |
| Encl. arable | 5.78 | – | 0.47 | 6.25 |
| Open arable | 31.34 | 30.94 | – | 62.28 |
| Encl. mkt. gdn. | 50.66 | 64.34 | 47.56 | 162.56 |
| Open mkt. gdn. | – | 28.83 | – | 28.83 |
| Hos./gdns. &c. | 0.98 | 27.61 | 2.99 | 31.58 |
| Encl. pasture | – | 1.00 | – | 1.00 |
| Total | 185.23 | 205.05 | 56.31 | 446.59 |
The sales covered almost one-fifth of Battersea, and therefore mark a significant redistribution of land. One-third of the open field changed hands. It is impossible to tell whether this change of ownership was a pre-condition for the housebuilding boom which began in the mid-1840s, or that Earl Spencer would not have followed that course in the absence of the enforced sales. It is true, however, that several developments did soon take place on land released by these sales, which is unlikely to have been purely coincidental.
The majority of the land sold in was agricultural (87%), of which enclosed meadow
p. 36(18.7%), enclosed market gardens (36.5%) and open-field arable (13.8%) were the most significant. A substantial number of so-called docks, used inter alia for timber storage, remained in manorial hands until this time, as did the land on which the “Red House” stood. Two substantial industrial premises were included: a vitriol manufactory at Nine Elms, and the silk factory at York Place, a three-storey building with associated offices and thirty-nine four-roomed cottages, covering five acres.
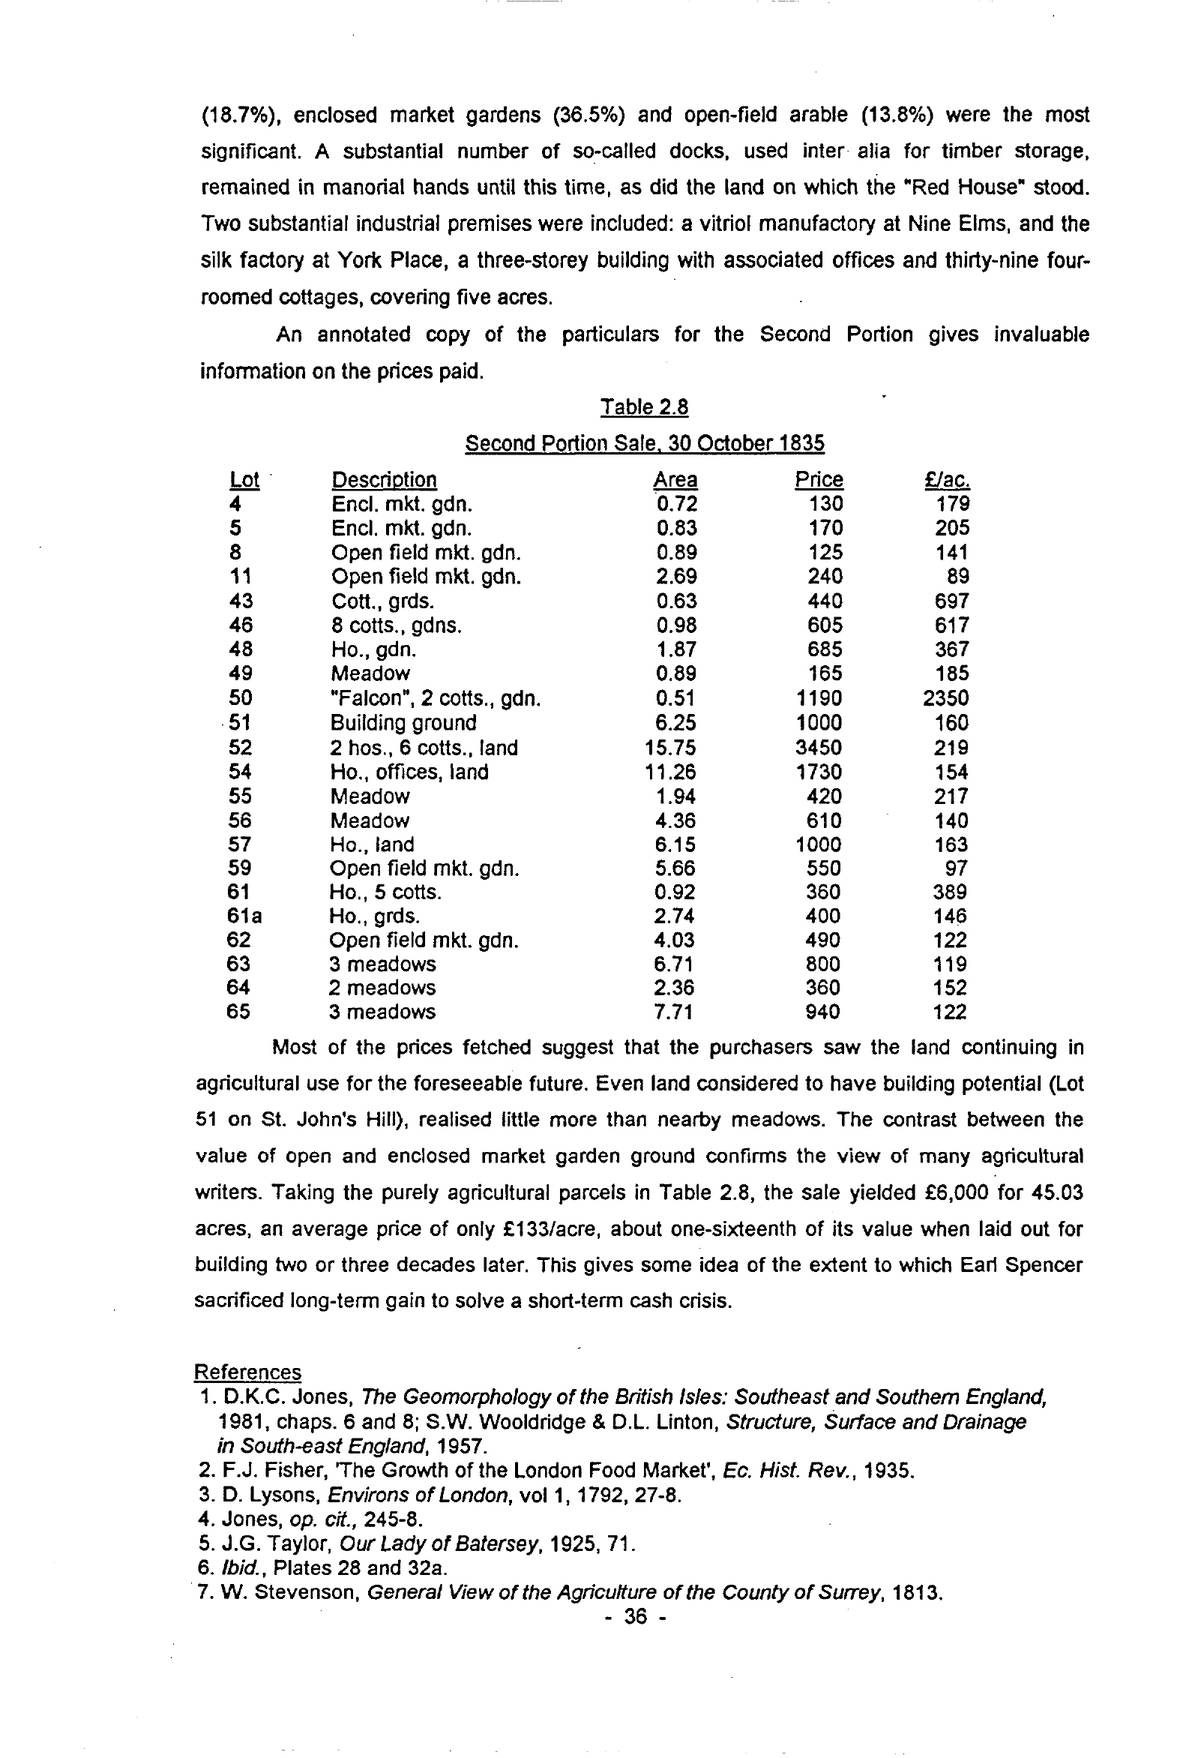
An annotated copy of the particulars for the Second Portion gives invaluable information on the prices paid.
| Lot | Description | Area | Price | £/ac. |
|---|---|---|---|---|
| 4 | Encl. mkt. gdn. | 0.72 | 130 | 179 |
| 5 | Encl. mkt. gdn. | 0.83 | 170 | 205 |
| 8 | Open field mkt. gdn. | 0.89 | 125 | 141 |
| 11 | Open field mkt. gdn. | 2.69 | 240 | 89 |
| 43 | Cott., grds. | 0.63 | 440 | 697 |
| 46 | 8 cotts., gdns. | 0.98 | 605 | 617 |
| 48 | Ho., gdn. | 1.87 | 685 | 367 |
| 49 | Meadow | 0.89 | 165 | 185 |
| 50 | “Falcon”, 2 cotts., gdn. | 0.51 | 1190 | 2350 |
| 51 | Building ground | 6.25 | 1000 | 160 |
| 52 | 2 hos., 6 cotts., land | 15.75 | 3450 | 219 |
| 54 | Ho., offices, land | 11.26 | 1730 | 154 |
| 55 | Meadow | 1.94 | 420 | 217 |
| 56 | Meadow | 4.36 | 610 | 140 |
| 57 | Ho., land | 6.15 | 1000 | 163 |
| 59 | Open field mkt. gdn. | 5.66 | 550 | 97 |
| 61 | Ho., 5 cotts. | 0.92 | 360 | 389 |
| 61a | Ho., grds. | 2.74 | 400 | 146 |
| 62 | Open field mkt. gdn. | 4.03 | 490 | 122 |
| 63 | 3 meadows | 6.71 | 800 | 119 |
| 64 | 2 meadows | 2.36 | 360 | 152 |
| 65 | 3 meadows | 7.71 | 940 | 122 |
Most of the prices fetched suggest that the purchasers saw the land continuing in agricultural use for the foreseeable future. Even land considered to have building potential (Lot 51 on St. John’s Hill), realised little more than nearby meadows. The contrast between the value of open and enclosed market garden ground confirms the view of many agricultural writers. Taking the purely agricultural parcels in Table 2.8, the sale yielded £6,000 for 45.03 acres, an average price of only £133/acre, about one-sixteenth of its value when laid out for building two or three decades later. This gives some idea of the extent to which Earl Spencer sacrificed long-term gain to solve a short-term cash crisis.